In the new economic regime of structurally higher inflation and tougher market conditions, traditional approaches to portfolio construction may no longer be sufficient to generate effective returns for investors. Enter the new generation diversifiers – liquid alternatives, which may significantly improve portfolio resilience and risk-adjusted returns when equity and bond markets sell off.
A major financial transformation
The post-pandemic years have led us to an unprecedented set of macroeconomic circumstances. While inflation is cooling after the initial post-COVID supply shock, we believe long-term trends such as ageing populations in major developed markets will see inflation and interest rates settle structurally higher than previously.
Within this new economic regime, the BlackRock Investment Institute believes the lion’s share of growth for investors will come from:
- Getting real – a new wave of investment into the real economy transforming economies and markets.
- Leaning into risk – looking for investments that can do well across scenarios and leaning into the current most likely one.
- Spotting the next wave – staying dynamic and ready to overhaul asset allocations when outcomes can be starkly different.
This has profound implications for the way we structure investor portfolios, as higher inflation can typically distort correlations between equities and bonds, creating conditions for hedge fund strategies to thrive. It also creates more challenging business conditions for listed companies, leading to greater return dispersion and a richer hunting ground for active managers.
On the back of these changing dynamics, we believe it’s pertinent for investors to address the typical mix of asset classes within portfolios. With performance advantages during higher rate environments, an ‘asset class neutral’ approach and flexibility to respond quickly to market events, we argue that liquid alternatives are worth considering as a long-term portfolio diversifier in a post-pandemic world.
In place of the 70-30 equity-fixed income split, we introduce the concept of the 70-15-15 portfolio, where a 15% allocation to liquid alternatives in place of fixed income can potentially improve risk-adjusted returns over time.
Uncovering alternative sources of diversification
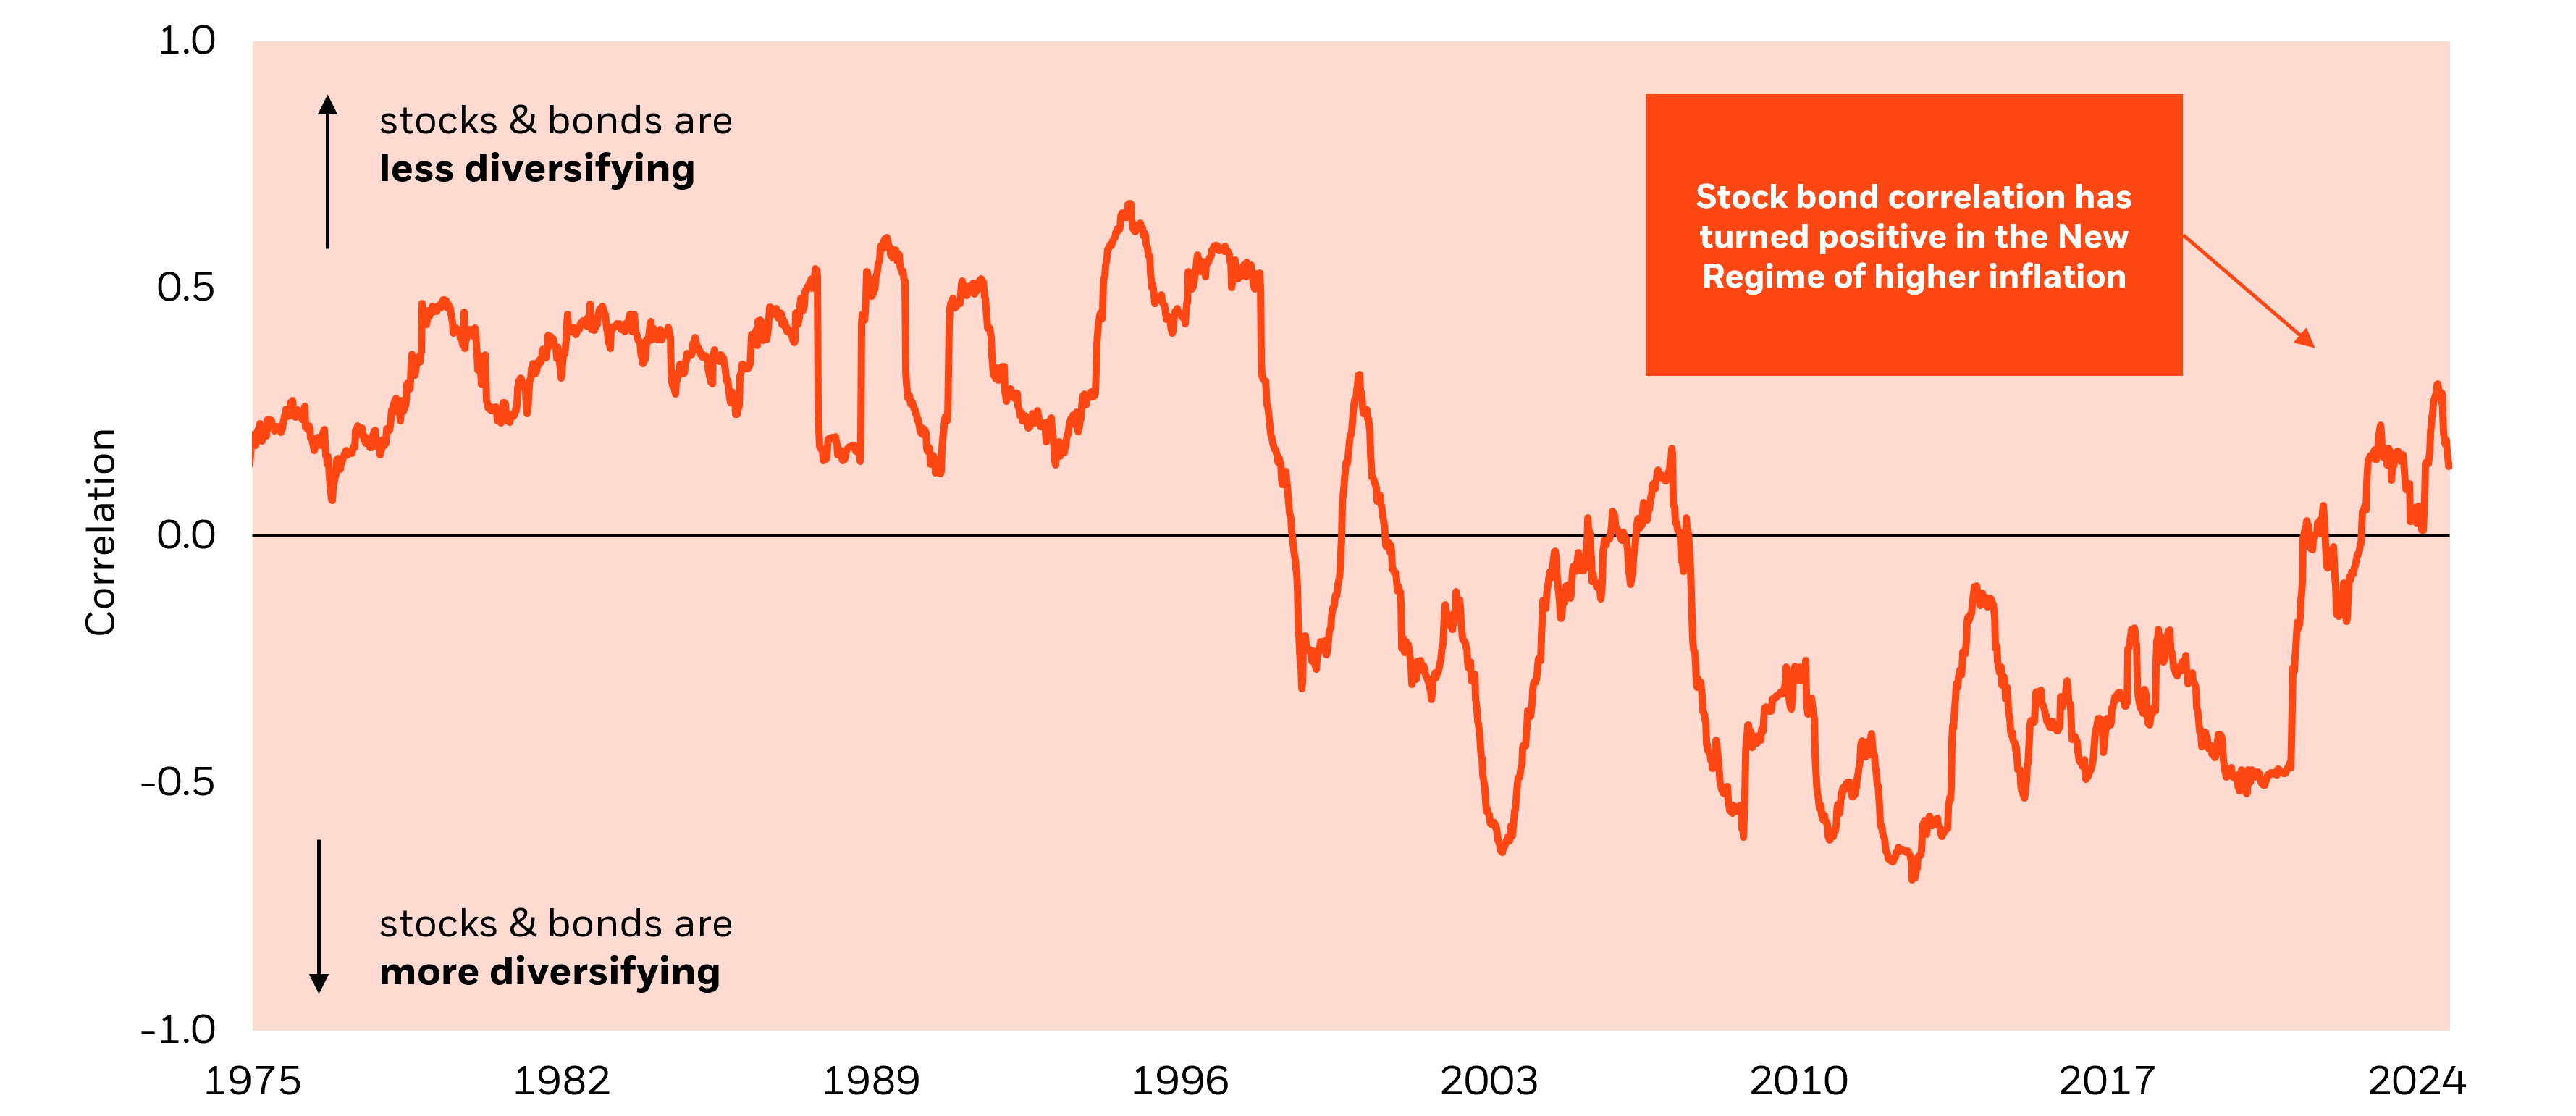
For investors looking to construct a diversified portfolio, bonds are typically thought of as an ideal complement to equities because of their low correlation to stock market movements. However, if we look at the relationship between equities and bonds through history, this hasn’t always been the case.

Source: BlackRock data as of 30 September 2024. Chart tracks the rolling correlation between the S&P 500 Index and US 10 Yr Treasury index. Past performance is not indicative of future results.
Bonds have typically provided the most diversification against equities when inflation has been low. Looking at the chart above, bonds and equities were positively correlated during the 1970s and 1980s, when Australian inflation averaged more than 9% per year.1 During the 2000s and 2010s, when inflation was within the RBA target of 2-3%2, bonds and equities were negatively correlated again.
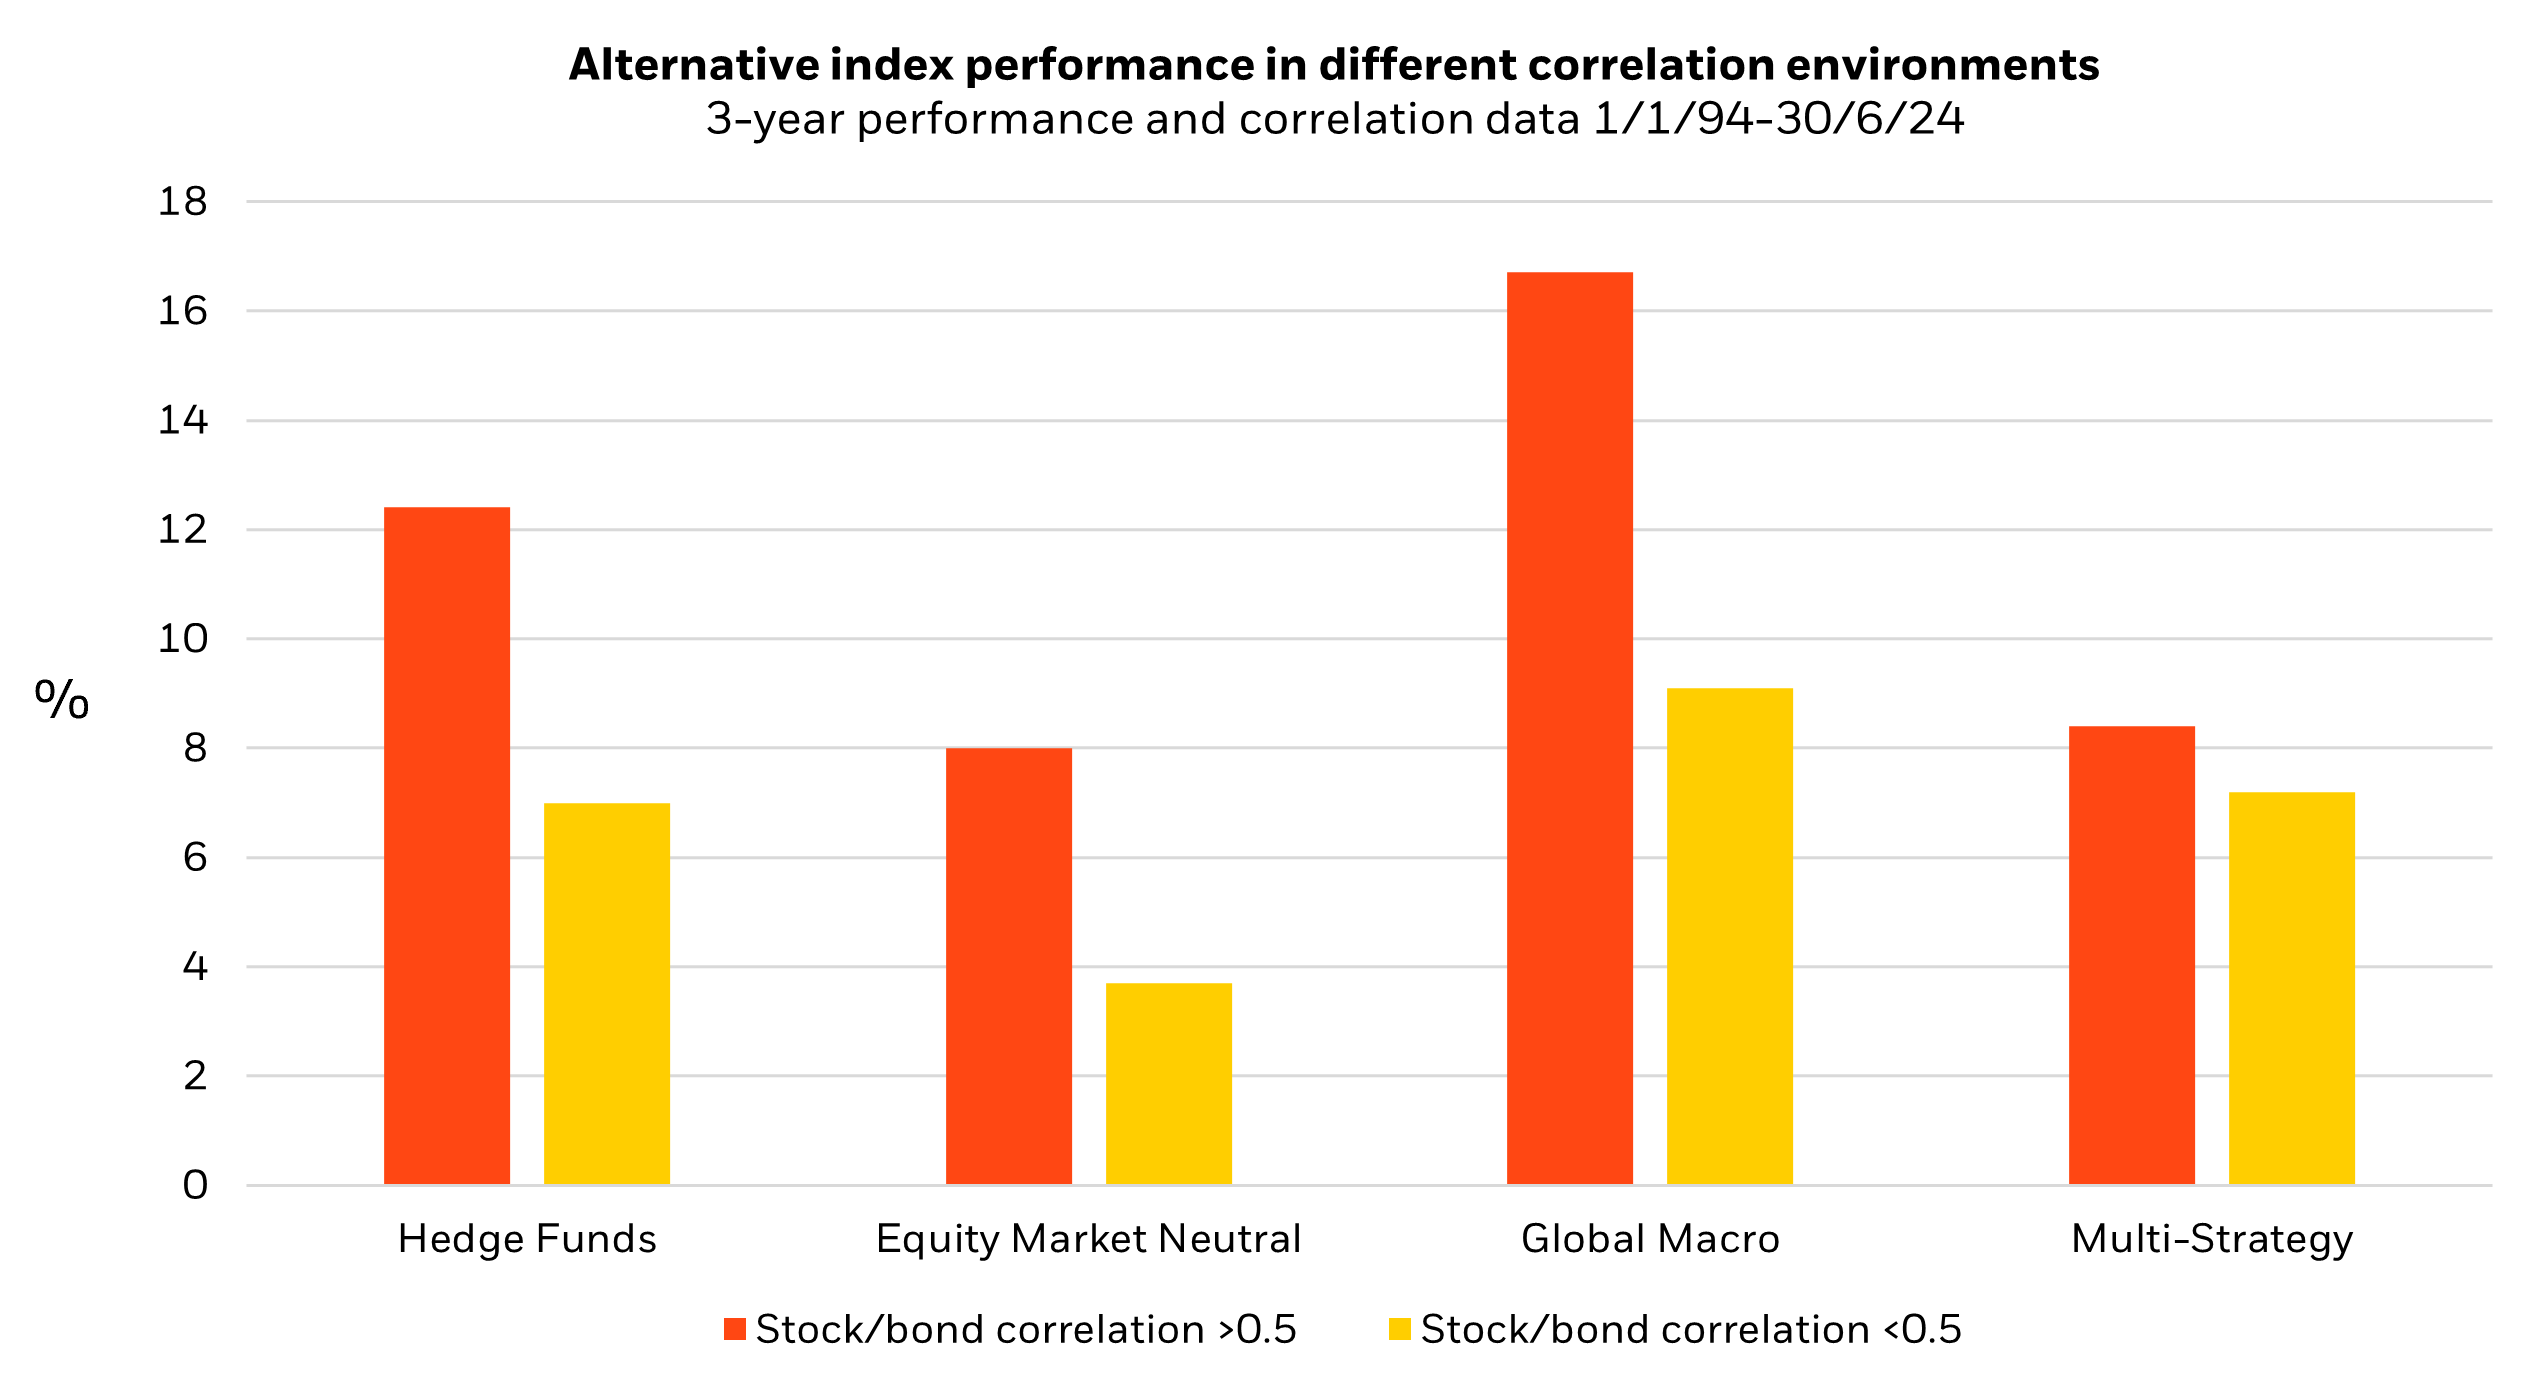
At the same time, hedge fund strategies have typically outperformed during years where stocks and bonds moved together, as you can see in the chart below.
Because hedge funds often use the cash rate as their performance benchmark, in years where inflation and interest rates are higher – and stocks and bonds more correlated - hedge fund strategies may generate more excess returns on a percentage basis. In the years where stock-bond correlation was greater than 0.5, cash returned an average of 3% per year, while when correlations were less than 0.5, cash returns 1.9% per year on average.3

Source: Morningstar, 30 June 2024. Hedge funds represented by the Credit Suisse Hedge Fund Index, Equity Market Neutral by the Credit Suisse Equity Market Macro Index, and Multi Strategy by the Credit Suisse Multi Strategy Index. Index performance is for illustrative purposes only. You cannot invest directly in the index. Past performance does not indicate future results.
An environment of higher return dispersion can also be advantageous for hedge fund strategies, which usually rely on active stock selection – and both long and short positions in equity markets - to generate outperformance. Looking at the post-COVID era, we see a significant difference in annual returns between the top dogs and underperformers in global equities compared to the decade before the pandemic, where returns were more equal across the board (see chart below).
Similarly, the difference between the best and worst performing equity market has also widened since global interest rates began rising in 2022 – which has implications for alternative strategies that derive a portion of alpha from macro investing styles.

Source: BlackRock, FactSet as of 31 December 2023. Annual stock dispersion is calculated by taking the average total return of the top half of performers of the MSCI All Country World Index (above or equal to the median) and subtracting the average of the bottom half. The stock dispersion chart shows the average of the annual dispersion observations across each period. Country dispersion shows average annual difference across the defined periods. Past performance is not a reliable indicator of future returns.
Liquid alternatives explained
Alternative investing strategies have been well known amongst professional investors for some time as a valuable source of risk-adjusted returns, particularly when traditional asset classes sell off – almost 1 in 5 public pension funds globally currently allocate to alternative strategies.4 However, they have also been traditionally thought of as high-risk because of their concentrated approach and investors’ restricted ability to redeem – which is where BlackRock’s liquid alternatives strategy may represent a new and more attractive access point for alternatives.
The liquid alternatives strategy essentially gives access to a fund of hedge funds which is highly diversified, representing over 30 different alpha strategies in a single portfolio.5 This means return sources are also diversified across each style – while the strategy has returned approximately 10% year to date, no more than 40% of active returns came from any one hedge fund that the strategy was invested in.6

Source: BlackRock, 31 August 2024. Performance is gross of fees and expenses using institutional X share class in Australian dollars. Past performance is not a reliable indicator of future results.
Having an option for daily redemptions also differentiates the strategy from other alternative strategies, which may typically impose monthly or quarterly redemption limits.7 Finally, the single layer fee structure may help to address investor concerns around value and fee erosion in typical multi-manager hedge fund strategies, which have been shown to generate lower net returns in recent years.8
Optimising portfolio performance
Given the current advantageous environment for alternative investing strategies, let’s test what happens when we add liquid alternatives to a sample balanced portfolio consisting of 70% MSCI World Index exposure and 30% Barclays Global Agg. (AUD Hedged) Index exposure.
If we replace half the fixed income index exposure with liquid alternatives, the portfolio generates a 7.5% annual return in the three years to August 2024, compared to 6% for the original 70-30 equities-fixed income split. Risk-adjusted returns are also improved, with the Sharpe ratio of the 70-15-15 portfolio at 0.53 over the three-year period, compared to 0.35 for the 70-30 portfolio.
This can largely be attributed to the strategy’s low correlation with both equities and fixed income, which helps to provide portfolio ballast during market downturns across the two asset classes. As demonstrated in the charts below, over the worst performing months in both bond and equity markets during the past six years, back-tested performance in the liquid alternatives strategy has been largely neutral, helping to offset downturns.


Source: BlackRock, Datastream 31 August 2024. Fund performance is shown gross of fees. Returns shown per month, not annualised. Global equities represented by the MSCI World ex Aus Index (AUD hedged). Global credit represented by Bloomberg Global Aggregate Corporate Bond Index (AUD hedged). Historic performance of the fund uses live track record of all sub funds in AUD wherever available. Index returns do not reflect management fees, transaction costs or expenses. Indexes are unmanaged and one cannot invest directly in an index. Past performance is not a reliable indicator of future results.
During positive months of equity and bond market performance, investors in the fund would also largely get to capture the upside of bull market conditions. Looking at simulated performance of the strategy over the same time period, 78% of positive months for the S&P/ASX200 index were also positive for the fund. Similarly, 83% of positive months for credit markets – represented by the Bloomberg Global High Yield Total Return Index – were also positive for the fund.9
Given the current uncertain macro environment, with pockets of volatility being created by economic data surprises and geopolitical events, we think investors would do well to consider additional portfolio ballast beyond traditional sources. By ‘diversifying their diversifiers’, we think investors can build additional resilience through cycles of equity and bond market sell-offs, potentially improving their long-term risk-adjusted returns.
With a nimble structure and advantageous macro tailwinds, we believe alternative strategies may be best placed to provide that additional support for portfolios in the years ahead. And as liquidity and fee structures modernise to take better account of client preferences, more investors are now able to access this type of strategy than ever before.

