
In this quarterly report the Australian Fixed Income team provide a concise domestic economic, credit and currency outlook for Q1 2025.
Paragraph-1
Paragraph-2
Paragraph-3
Paragraph-4,Accordion-1
Expect a slow easing cycle
The Reserve Bank of Australia (RBA) kept the official cash rate unchanged at 4.35% in Q424, as we had expected. Our base case remains for the RBA to commence easing in early 2025 at either the February or April meetings depending on how the data evolves over the next few months. Increasing our confidence is the shift to a more dovish stance by the RBA. When the easing cycle here commences, we think the cash rate could converge to 3.60% by the end of 2025.
The recent softening in tone and dialling down of rhetoric by the RBA suggests to us they have become more confident that core inflation remains on track to fall in line with their projections. Headline inflation is running at 2.8% YoY, while trimmed mean is 3.5% YoY1. Subsidy effects have delivered a significant and temporary headline disinflation impulse. With a federal election due by May 25, there is a high probability the subsidies will be again extended which will keep headline inflation low. Although the RBA forecasts don’t see core inflation at the midpoint of the 2-3% target band until 2026, the Board doesn’t need to wait to cut rates if they think inflation is “sustainably” falling.
We noted last quarter that labour market conditions were important for the RBA in choosing when to ease policy. While this remains true, very sluggish GDP growth has become an increasing worry for the bank. The RBA acknowledges the labour market is tight and is outperforming versus their expectations. With a current jobless rate of 3.9%, just 0.5% above the post-Covid low of 3.4% (October 2022)1, the risks of a rapid deterioration in labour market conditions has diminished considerably. The RBA expects only a small pick-up in the unemployment rate to 4.4% by Dec-20252.
Consumer sentiment is still weak, but we expect conditions to improve moderately through 2025. House prices in the major capital cities are expected to remain under pressure in the short-term, however, rate cuts in 2025 should help to improve affordability metrics. Investment in the housing sector will increase, with the government's ambitious housing target of 1.2 million3 dwellings over five years underpinning supply. Wage price growth is slowing, with the RBA's preferred wage measure – the Wage Price Index (excluding bonus) - running at 3.5% YoY1, the slowest since 2022. The very weak pace of productivity growth remains a challenge for the RBA and limits the degree to which monetary policy can be eased in 2025.
The new structure of the RBA Board becomes effective from 1 March 2025 and based on the membership of the interest rate setting committee, we’d expect to see a smooth transition with respect to their decision-making processes. On the fiscal side, with a federal election in 2025 (by 17 May at the latest), it is expected the government will bring down an early 2025-26 Federal Budget around March. As things stand, the deficit starting point of ~1% of GDP will be a "bit weaker" than previously forecast. With cash deficits baked in over the forecast horizon, there will be increased issuance of government bonds in 2025.
While there remains some uncertainty around what a Trump administration might do with regards to tariffs, recent announcements in China by the Politburo to counter some economic fears are moderately positive for the Australian economy. Chinese policy makers have vowed to embrace a “moderately loose” monetary policy in 2025, and pledged “more proactive” fiscal policy, signalling more rate cuts ahead and shifting from a “prudent” strategy that’s held for nearly 14 years. The RBA has suggested that if China is impacted negatively by tariffs, that could create local disinflationary forces, as it attempts to shift some if its exports to other markets, including Australia.
The first full 25bp rate cut has been priced in for April 25 by the market, with a >50% chance of a 25bp cut priced in as early as February. We think that’s fair pricing given the recent change in tone by the RBA. The implied terminal rate is around 3.60% by the end of 2025, which is close to the RBA’s estimated neutral rate level. We would expect an easing cycle to be a slow and drawn-out affair as the RBA opts against pre-committing to any particular easing path.
Services Inflation is expected to remain sticky

Source: BlackRock, Bloomberg as of 23/12/2024.
Overweight on Australian credit
Credit again performed well in Q4 capping off a strong year for returns in the local IG corporate market. Despite some periods of spread volatility driven by offshore events, the general “risk-on” tone provided by strong equity markets, soft economic landings, global central bank easing and minimal credit defaults, all proved to be a powerful force for spread compression.
The corporate market continued to benefit from meaningful fund inflows from offshore investors, particularly Asian investors. Inflows have been the overriding narrative and demonstrate how “following the money” has been an important factor to consider when positioning credit exposures. Inflows have also supported new issuers accessing the domestic primary market in a sizeable way helping to diversify portfolios. We expect this trend to continue given the relative attractiveness of domestic ‘all-in’ market yields.
From a fundamental standpoint, companies have made good progress in pushing out maturities, which has eased near-term liquidity pressures and provides some cushion if market volatility arises and/or investors become more risk averse. Estimates of supply for 2025 look very manageable for the local market to take down.
After two years of spread tightening, we believe Australian credit spreads are likely to trade sideways in 2025. We remain overweight credit as investors can continue to pick up ‘carry’ in a relatively benign macro environment. We note that U.S. IG and HY spreads are very tight and further compression, while feasible, is likely to be a slow grind. For global investors, the Australian corporate market continues to offer a lower beta and low duration versus the major U.S. and EUR credit markets. For Asian investors a spread pick-up also remains on offer.
We remain alert to periods of market volatility centred around deepening geopolitical rifts and Donald Trump’s return to the White House in January. The outcome of each could have wide-ranging market ramifications.
Australian Credit Spreads

Source: BlackRock, Bloomberg as of 12/12/2024.
AUD performance impacted
After reaching a high of US$0.6910 cents on October 1, it was all downhill for the AUD in Q4, culminating in a breakdown below US$0.63004 cents in late December. The decline followed the Fed’s decision to signal a slower pace in their 2025 easing cycle and a higher terminal rate. A perceived more hawkish Fed saw USD demand against anything and everything and the DXY poised to close at YTD highs. Relative US growth outperformance in 2025 and a reluctant Fed (and higher US yields) could further strengthen flows into USD.
While the initial reaction of the AUD to China’s stimulus measures in Q324 was positive, the market enthusiasm around what this actually delivered for the Chinese economy faded during Q4. China's economic performance has been muted which has had an adverse impact on the AUD. To help reverse this trend, a significant step up in China’s economic stimulus to boost consumption and housing will be required in 2025.
With all indications that the new Trump administration wants to hit the ground running on key strategic priorities - tax cuts, tariffs and supply-led oil price declines, this has the potential to be a challenging combination for the AUD. Coupled with a slight dovish RBA recalibration, it’s difficult to see the AUD above US$0.6500 cents in Q1.
AUD / USD

Source: BlackRock, Bloomberg as of 23/12/2024.
Recent Market Data
-
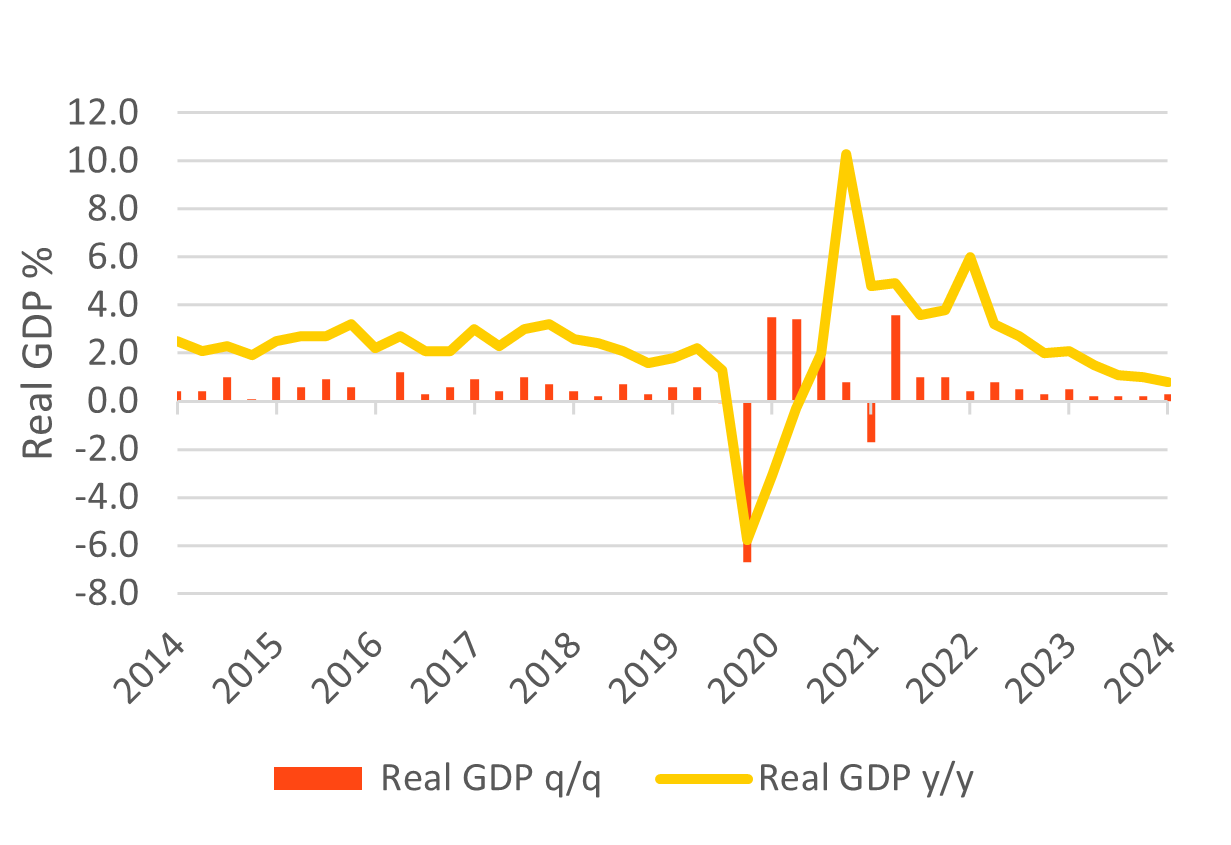
▲ QoQ GDP grew 0.3%, following a 0.2% QoQ rise.
▼ YoY GDP slowed from 1.0% to 0.8%.In per capita terms, GDP contracted by -0.3% QoQ /-1.5% YoY. Household spending was flat on the quarter driven by a -0.1% decline in essential spending largely due to electricity and gas spending falling -16.7%. Real household disposable income continued its recovery rising by +0.8% QoQ, lifting to 2.3% YoY. Despite the rise, consumers remained cautious choosing to repair household balance sheets which saw the savings rate lift from an upwardly revised 2.3% to 3.5%. Overall growth has increasingly been supported by population growth and the public sector. We expect that after an initial increase in savings that household consumption will become more supportive of economic growth.
Australia Real GDP
Source: ABS, Bloomberg, BlackRock as of 23/12/2024.
-
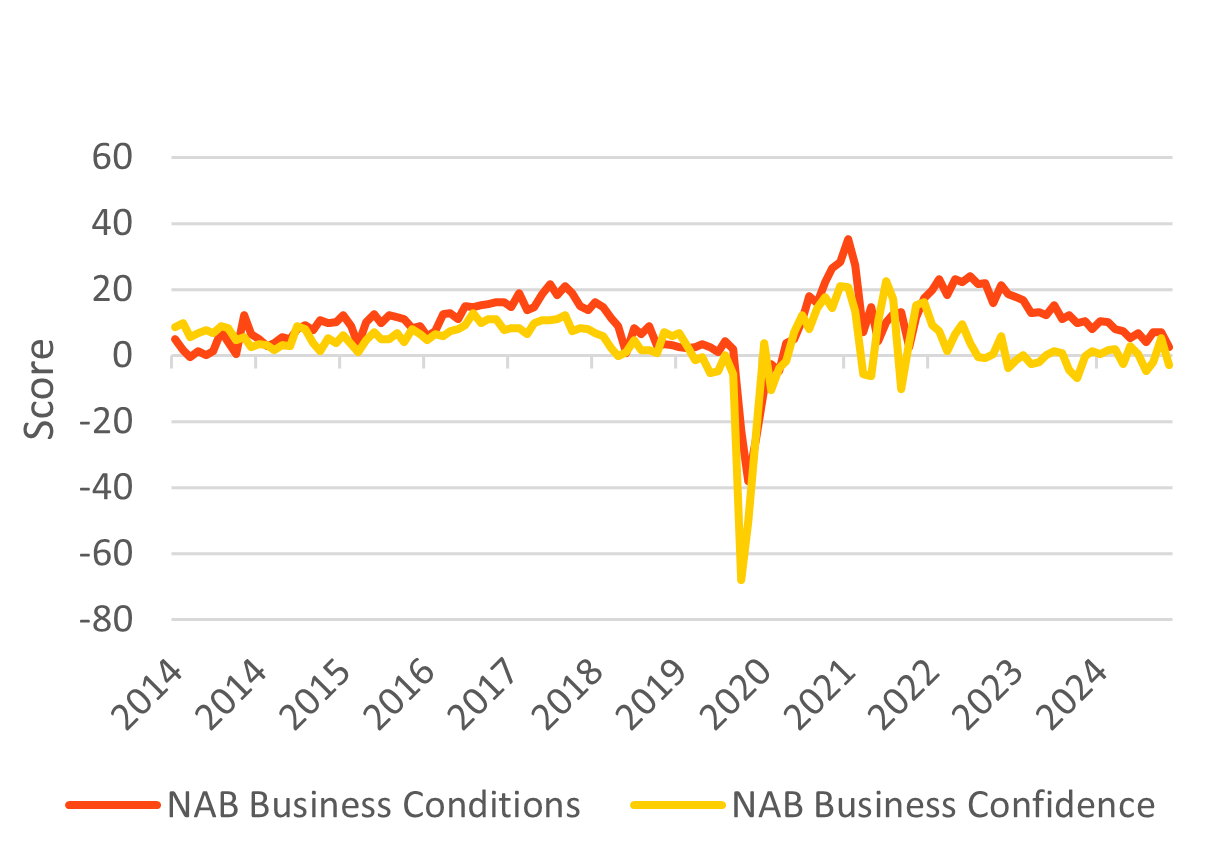
▼Conditions fell by 1pt from +3pts (Aug) to +2pts (Nov).
▲ Confidence rose by 1pt from -4pts (Aug) to -3pts (Nov).Over the quarter, the NAB Business Survey saw business confidence improve to -2bps in Sep and +5pts in Oct before reversing gains and falling sharply to -3pts in Nov. This decline was significant across most sectors except construction and mining, with confidence remaining weakest in retail and wholesale. In line with the trend, business conditions rose to +7pts in Sep, remained flat in Oct and fell to +2pts in Nov. The decline in conditions was mainly due to a decrease in trading conditions, though all three subcomponents of business conditions are now at or below average. Capacity utilization continued to slowly trend lower though remained above its long run average.
NAB Business Survey
Source: NAB, Bloomberg, BlackRock as of 23/12/2024.
-
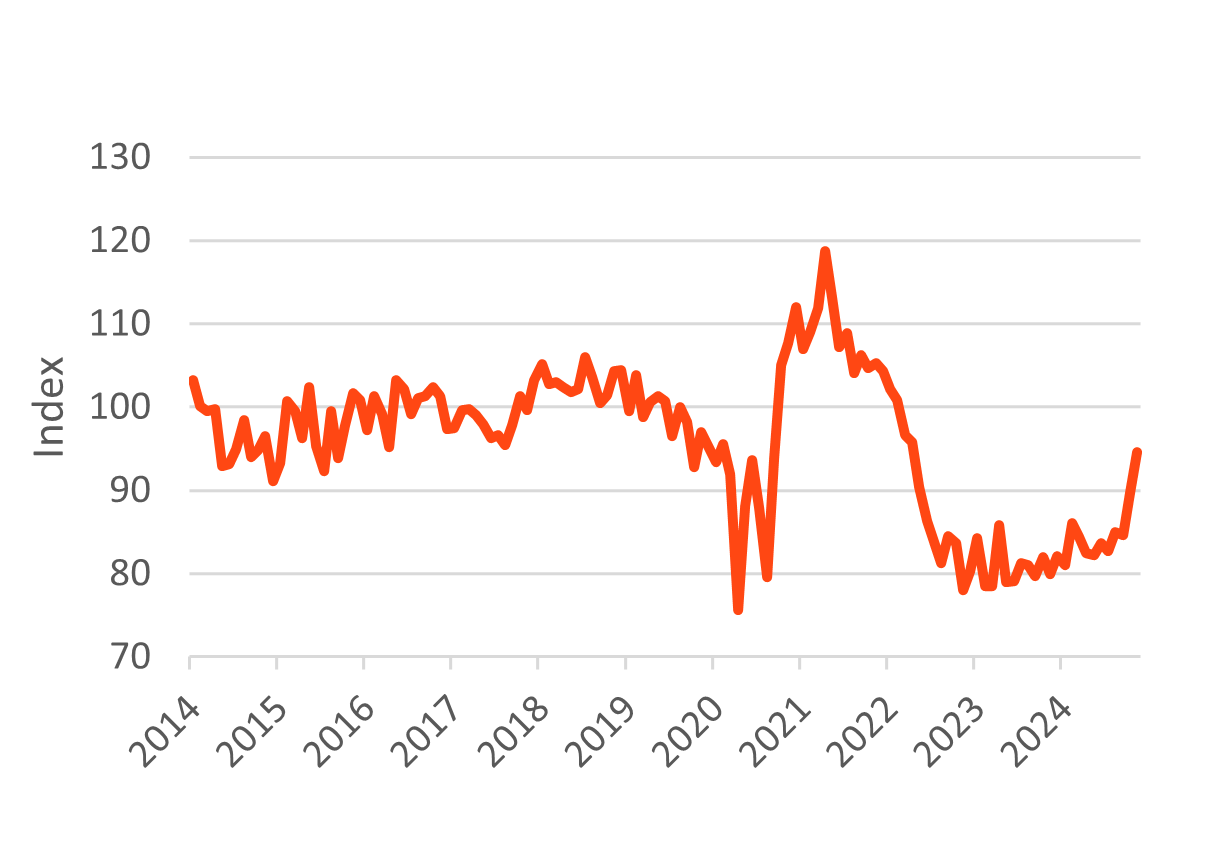
▼ The Westpac-M.I. Index of Consumer Sentiment fell 2.0%.
MoM from 94.6 in November to 92.8 in December.While consumer sentiment has improved materially over the year, rising by +13.0%, the index results remain pessimistic. Improvements in ‘current conditions’ were offset by a loss of confidence in the outlook, particularly for the economy, due to a disappointing Sep quarter national accounts update, inflation uncertainty, and a more unsettled global backdrop. The ‘economic outlook, next 12 months’ sub-index dropped 9.6% to 91.2, and the ‘economic outlook, next 5 years’ sub-index fell 7.9% to 95.9. Despite this, the ‘family finances vs a year ago’ sub-index rose 6.9% to 84.2, the ‘family finances, next 12 months’ sub-index, though down 0.9% from November, stands at 103.2, indicating more optimism than pessimism, and the ‘time to buy a major household item’ sub-index improved 4.8% to 89.2.
Source: Westpac, Bloomberg, BlackRock as of 23/12/2024.
-
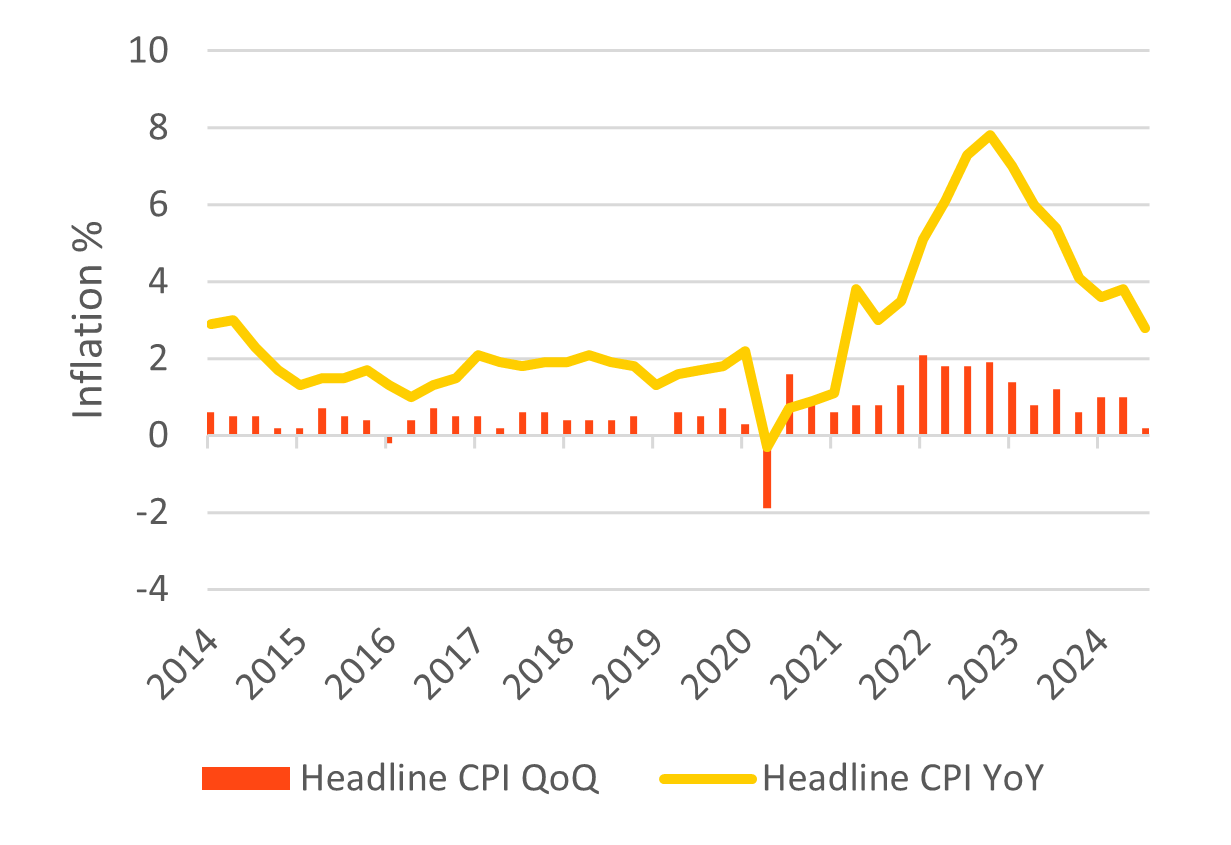
▲ Headline CPI increased by 0.2% QoQ.
▼ Annual inflation fell 1.0% from to 3.8% to 2.8%.A closely watched measure of core inflation, the trimmed mean, also rose by 0.8% QoQ with the annual rate falling from 3.9% to 3.5%. The sharp fall in headline inflation was due to electricity subsidies driving weakness in electricity prices (-17.3% QoQ), lower fuel prices (-6.7% QoQ), and base effects. The annual rate of goods (+1.4%) continued to run softer than services (+4.6%). Likewise tradable inflation (+0.6% YoY) is running significantly lower than the domestically generated non tradable inflation (+4.1% YoY). A further moderation in inflation is expected in Q4 as subsidies continue to impact headline inflation. Trimmed mean is also expected to fall albeit more slowly with sticky housing group showing early signs of easing.
Headline CPI
Source: ABS, Bloomberg, BlackRock as of 23/12/2024.
-
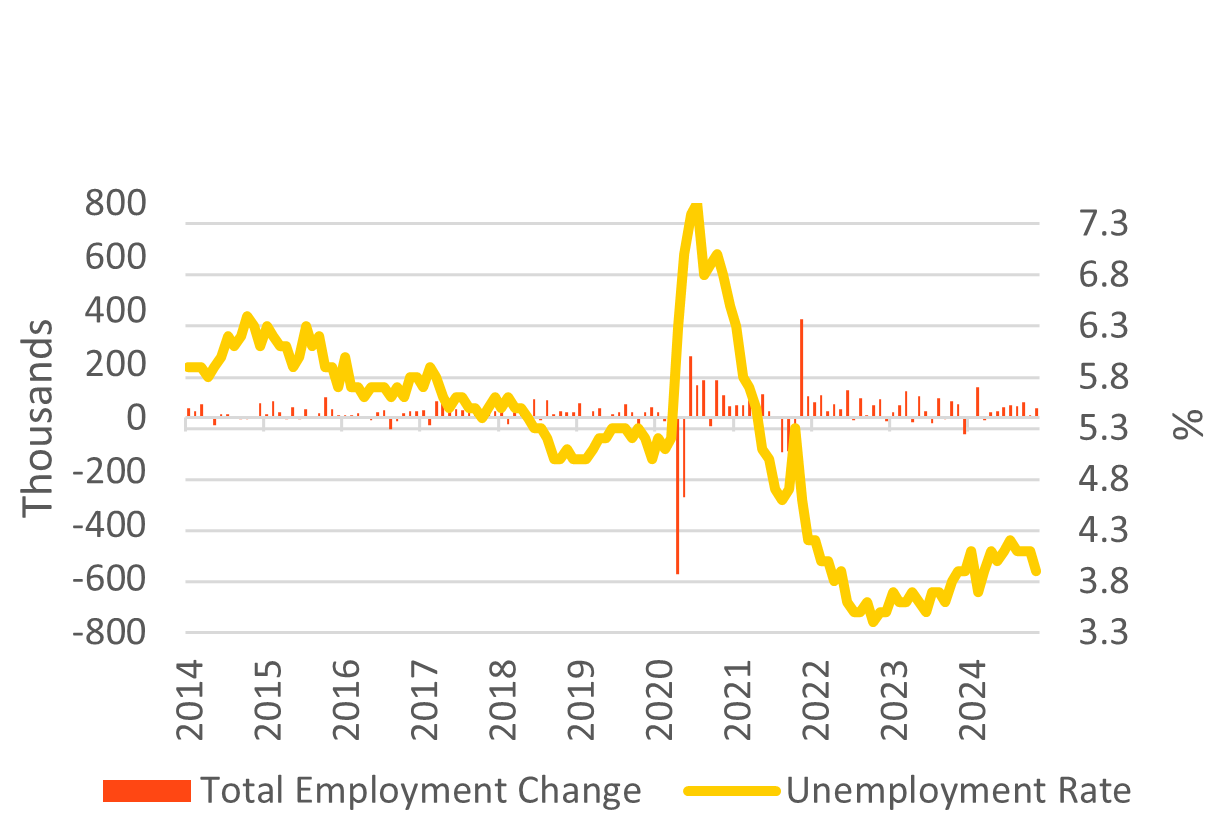
▲ Number of employed people grew by 35,600, seasonally adj.
▼ The unemployment rate fell from 4.1% to 3.9%.The November labour market report surprised the market with 35.6k jobs created vs the consensus view of 25k. The unemployment rate fell from 4.1% to 3.9% and the participation rate also fell from 67.1% to 67%. Underscoring the resilience of the labour market the underutilization rate fell from 10.3% to 10.0%. Strong population growth and labour force participation have been driving strong labour supply. However, demand for labour driven by non-market sector jobs has been equally as strong. Resilience has been underpinned by govt-related jobs which should persist in the near term before some easing of demand sees jobs growth slow with an anticipated easing in supply as population growth slows.
Monthly Employment Change & Unemployment Rate
Source: ABS, Bloomberg, BlackRock as of 23/12/2024.
-
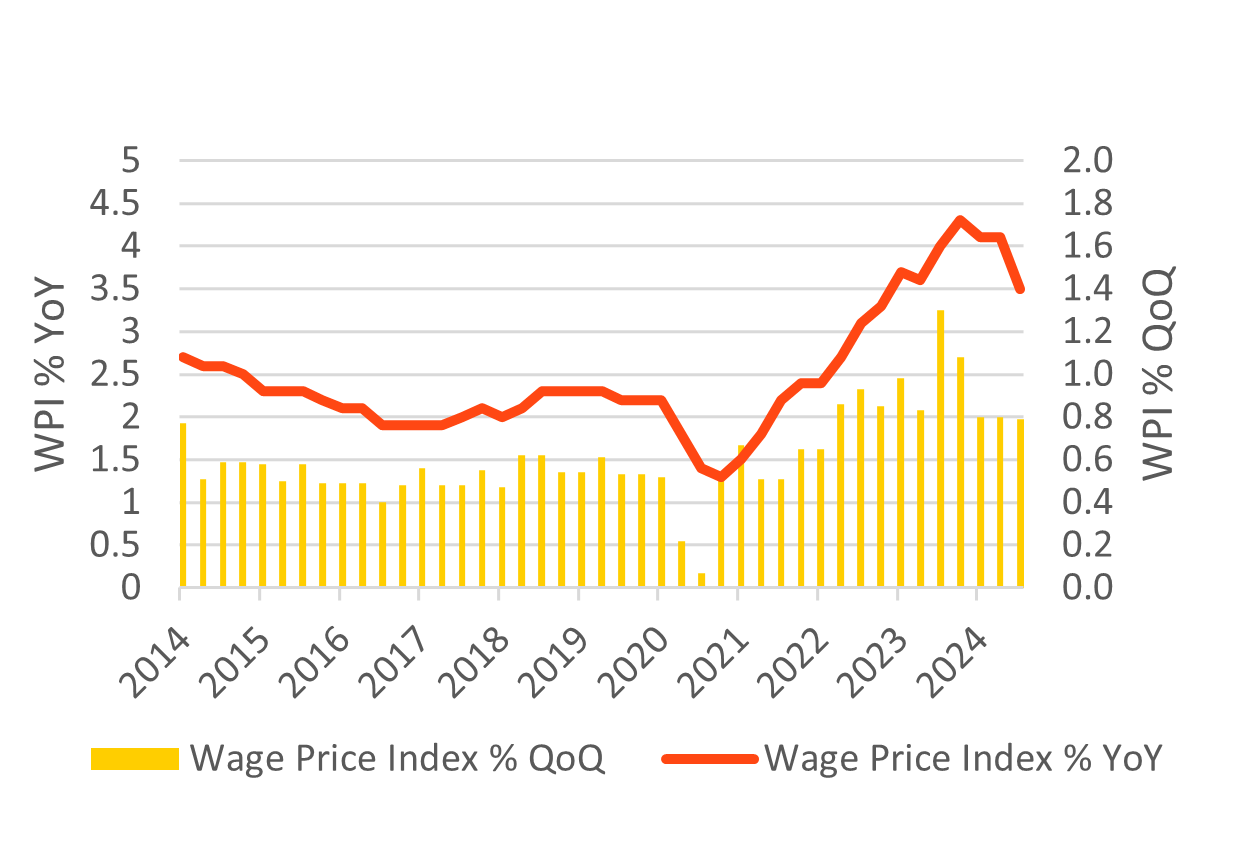
▲ Wages increased by 0.79% over Q3.
▼ Annual wage growth fell sharply from 4.1% to 3.5% YoY.In Q3 Australian Wage Price Index increased by 0.79% QoQ following a 0.80% increase in Q2-24. The annual rate fell sharply from 4.1% to 3.5% due to base effects, the weakest reading since Q4-22. Private sector wages grew by 0.8% QoQ, and 3.5% YoY. Public sector wages increased by 0.8% QoQ and 3.7% YoY. The ABS noted that while a similar share of jobs recorded a wage change as a year ago, the average change in wages was much lower at just 3.7% compared with 5.4%. The large drop in wages was expected as the FWC handed down a 3.75% increase in award wages this year, significantly lower than the 5.75% increase in 23-24. The RBA expected wages growth of 3.4% YoY in 2024 which would imply that wages would need to accelerate to 0.9-1.0% in Q4 for this to be achieved.
Wage price index
Source: ABS, Bloomberg, BlackRock as of 23/12/2024.
-
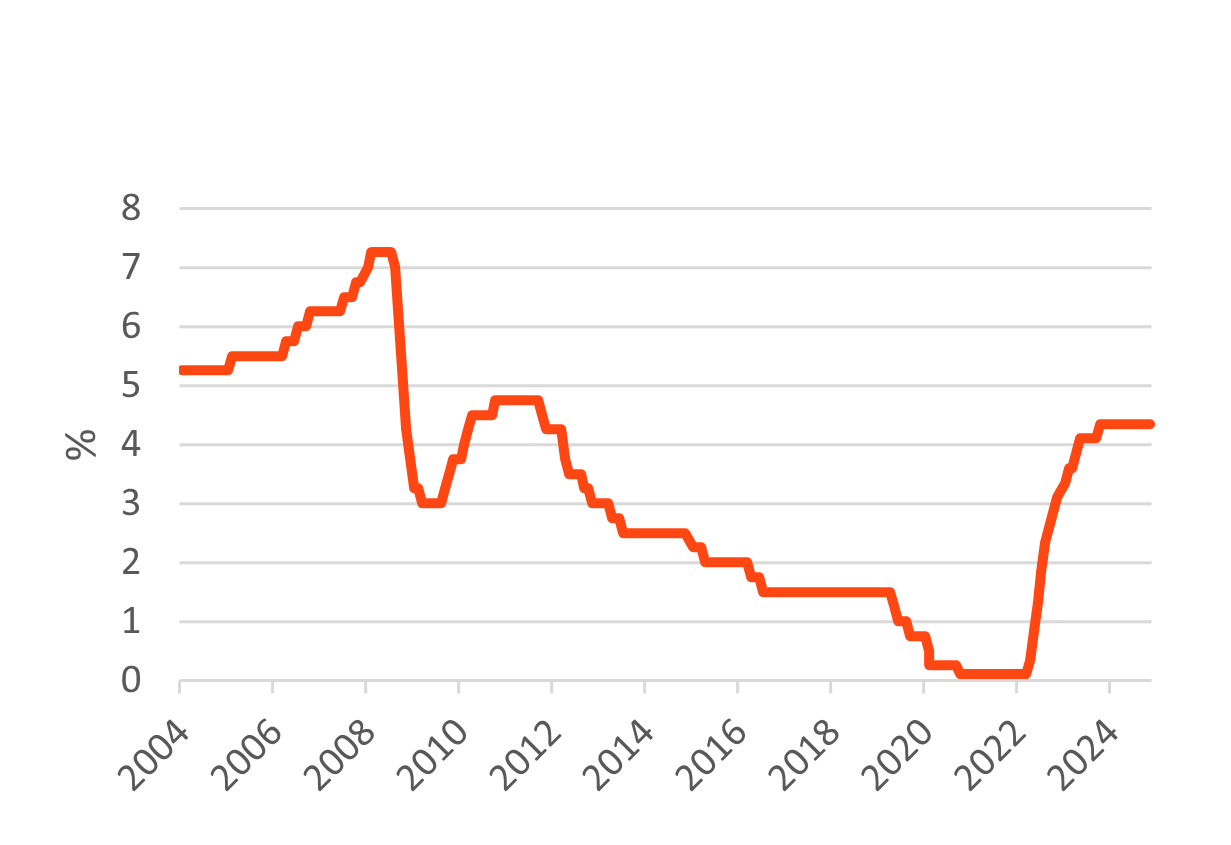
▶ The RBA left the cash rate unchanged at 4.35% during the quarter, as widely expected.
The RBA left the cash rate unchanged at 4.35% and the interest on excess reserves at 4.25%. They removed the neutral policy bias that “they are not ruling anything in or out”, replacing it with more dovish language that “the board is gaining confidence that inflation is moving sustainably towards target”, and that “some of the upside risks to inflation appear to have eased”. The RBA assessed that economic data had been mixed but on balance softer than was forecast back in November. The RBA felt that further progress had been made in closing the output gap and potentially faster than had been anticipated in November. The Board continues to see the macro-economic environment as highly uncertain and maintain that returning inflation back to target is its highest priority.
RBA Cash Rate Target
Source: RBA, Bloomberg, BlackRock as of 23/12/2024.
-
▲ The CoreLogic national HVI rose 0.1% in November.
▲ The CoreLogic national HVI increased 5.5% over the year.CoreLogic national home value index rose 0.1% in November, the weakest growth since January 2023. The annual rate has slowed to 5.5%. National house prices are slowing with significant divergence across states. The capital cities of Sydney, Melbourne and Hobart all fell marginally in November. Further house price moderation is expected as auction clearance rates fell to 57% the lowest since Dec-22, and below 60% which is consistent with flat prices. Housing affordability continues to be a challenge for further house price appreciation. Weaker housing conditions have led to a rebalancing of supply as vendor activity increased in spring, while purchasing activity appears to be slowing down.
Core Logic Australian Home Value index

Source: CoreLogic, BlackRock as of Nov 2024. Chart as of 23/12/2024.