FIVE METRICS FOR EVALUATING ETP MARKET QUALITY

Exchange traded products (ETPs) have become indispensable tools for analysing and investing in financial markets—but not all ETPs are created equal.

Child using a camera

Over the past three decades, the ETP market in Australia has swelled to almost $170 billion in assets under management and more than 360 products1. With such a huge range of choice available for investors, it’s important to do your due diligence and understand exactly what you’re getting with any ETP you decide to invest in.

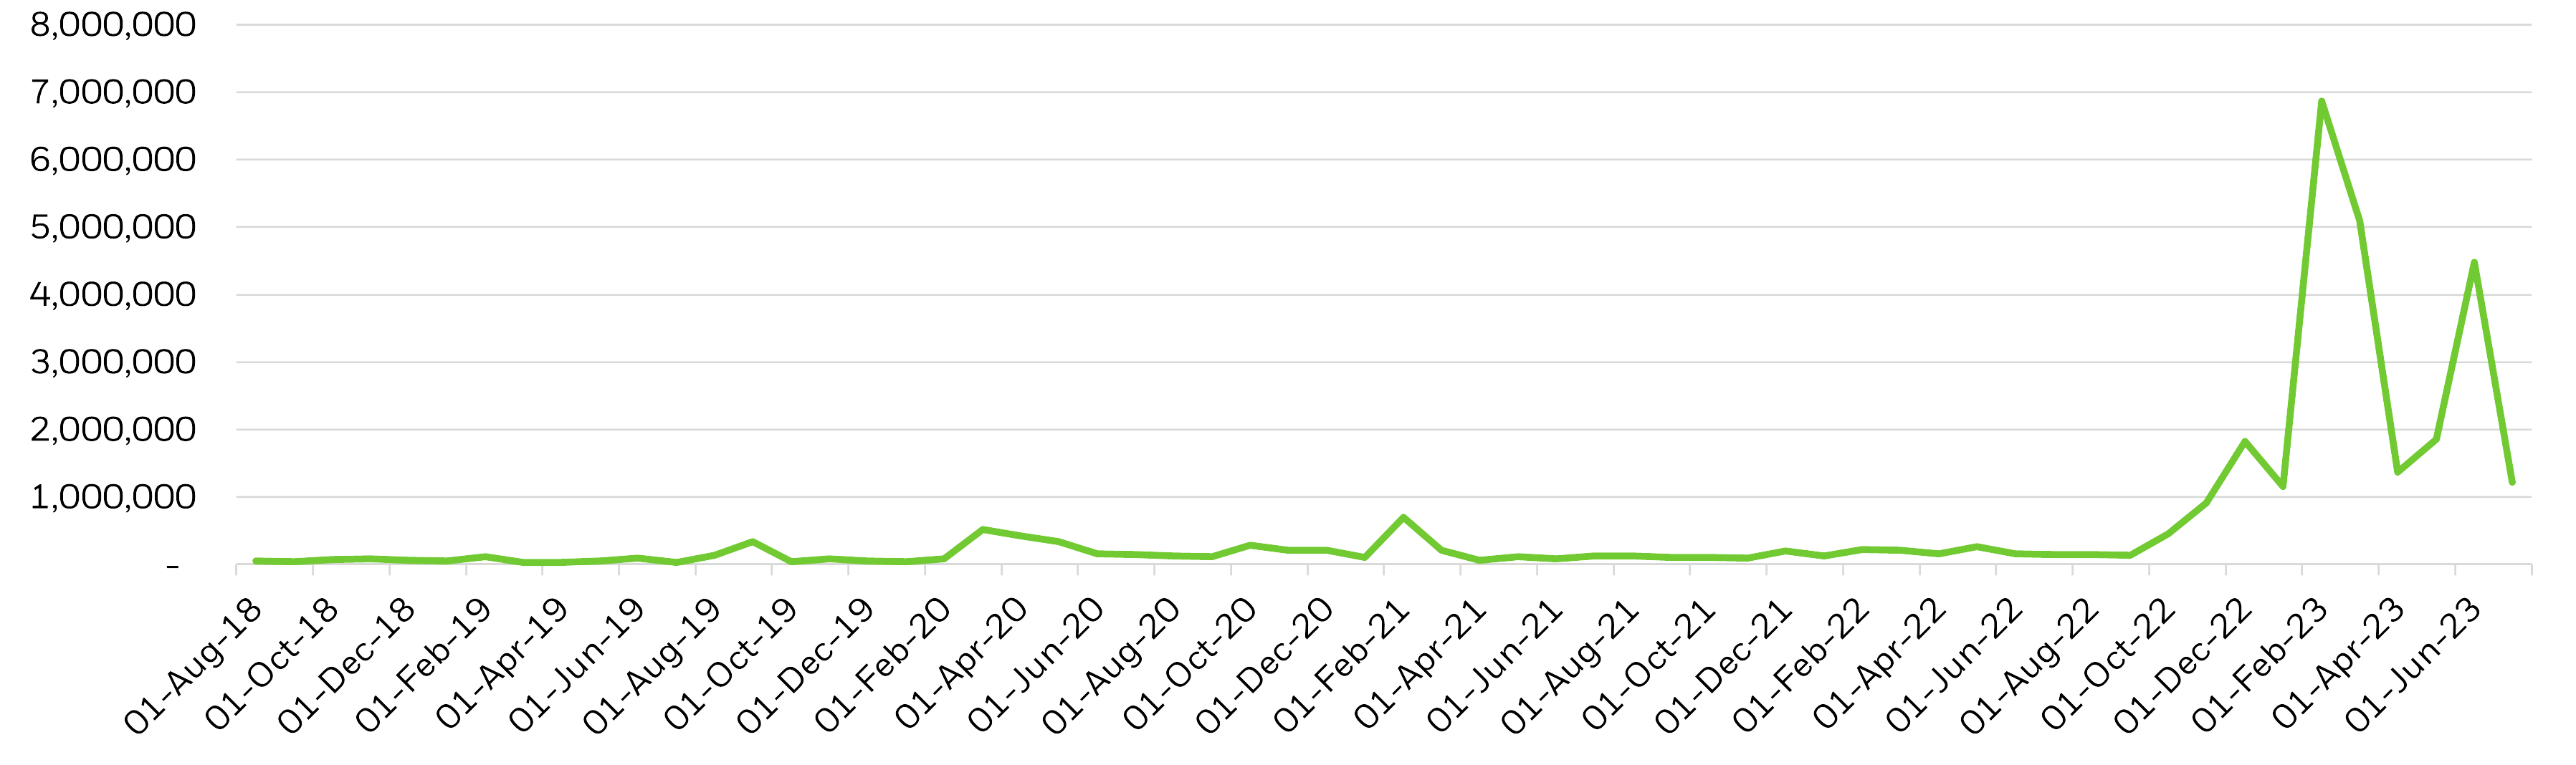
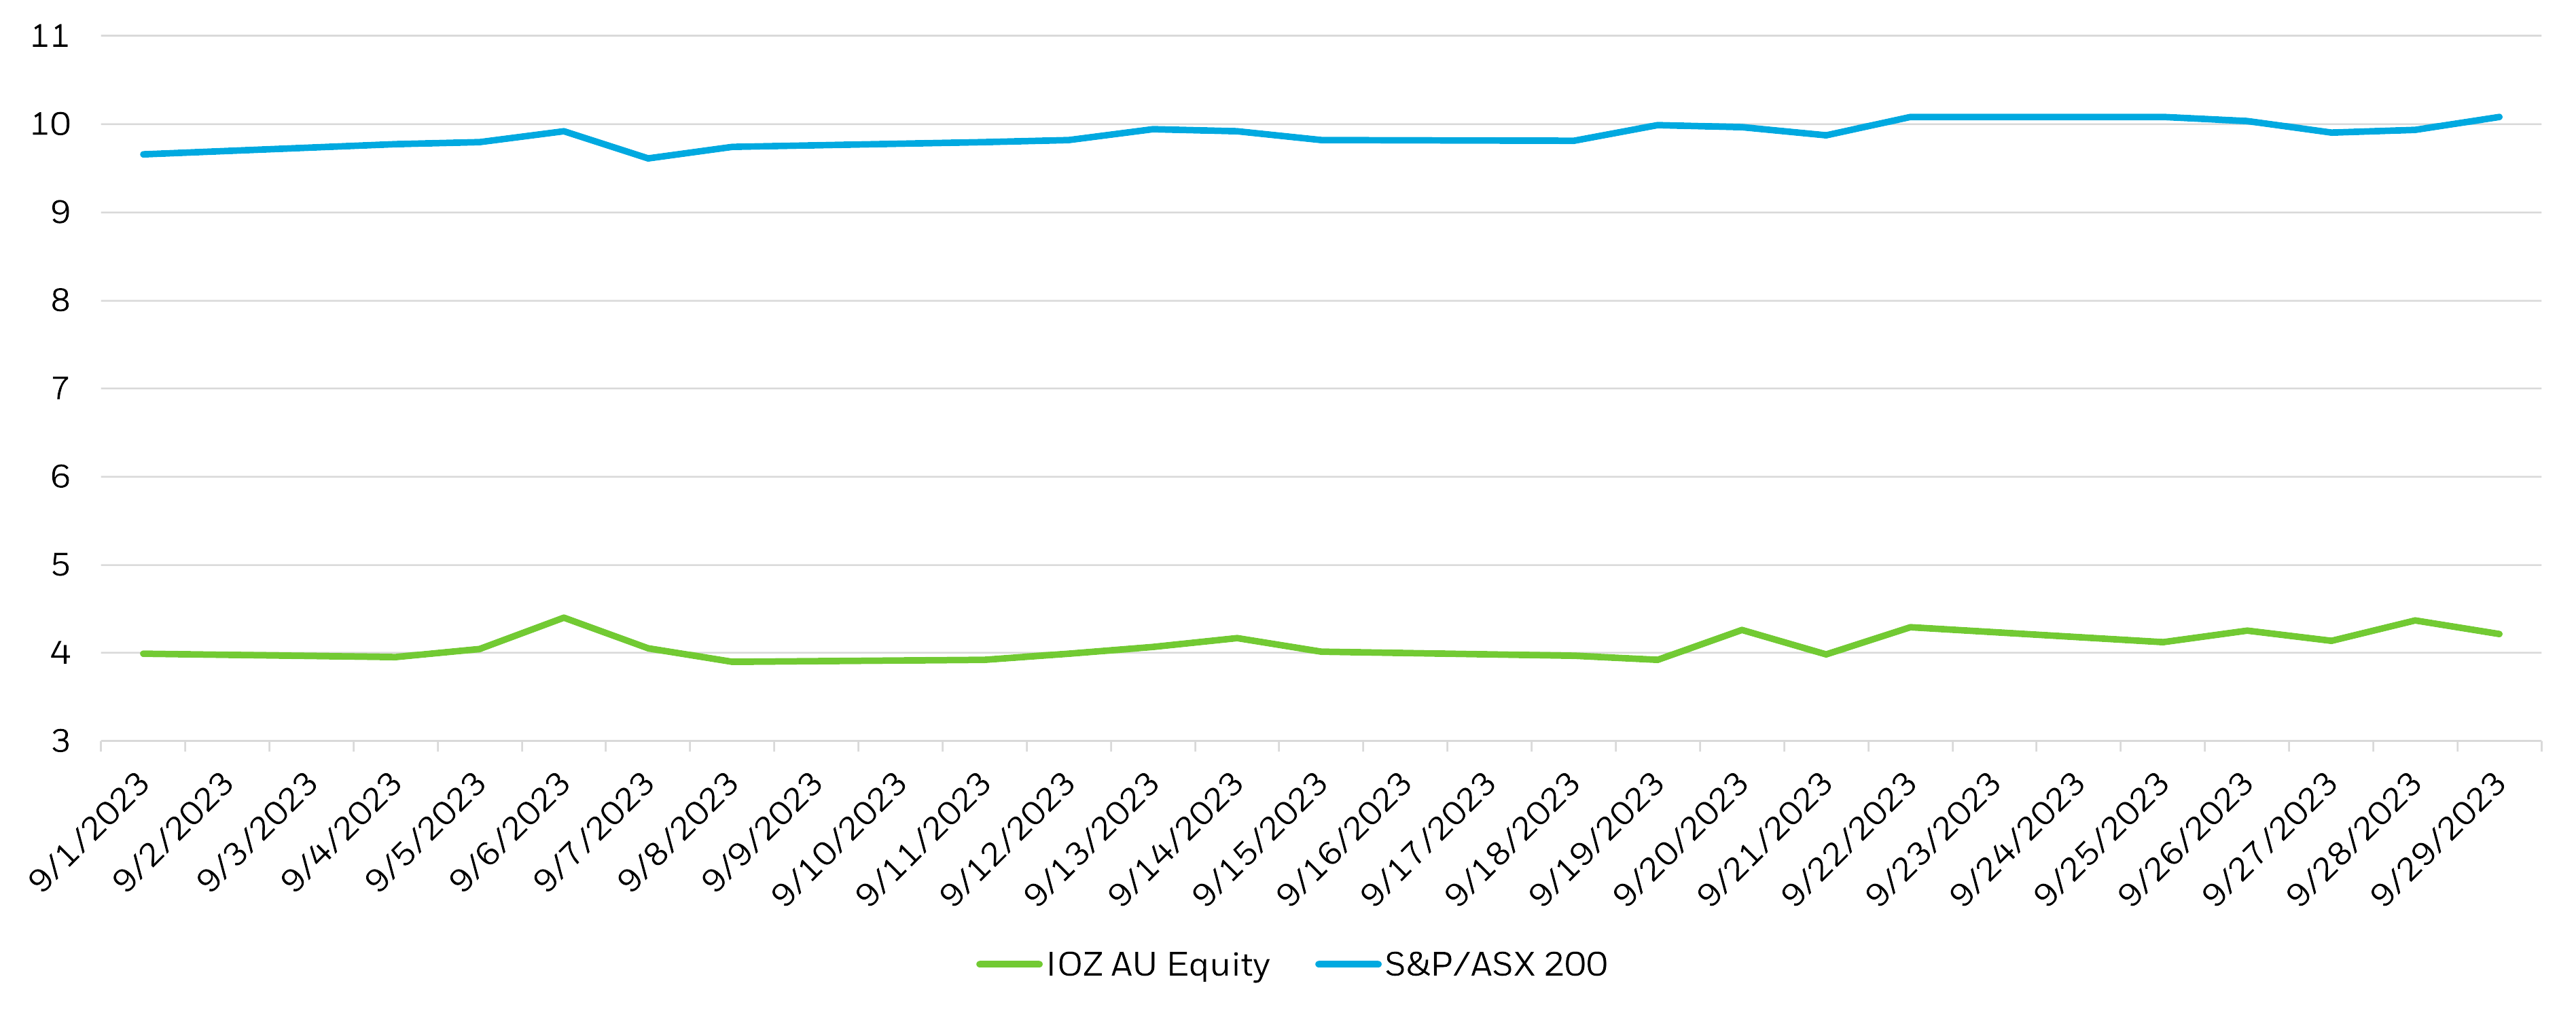
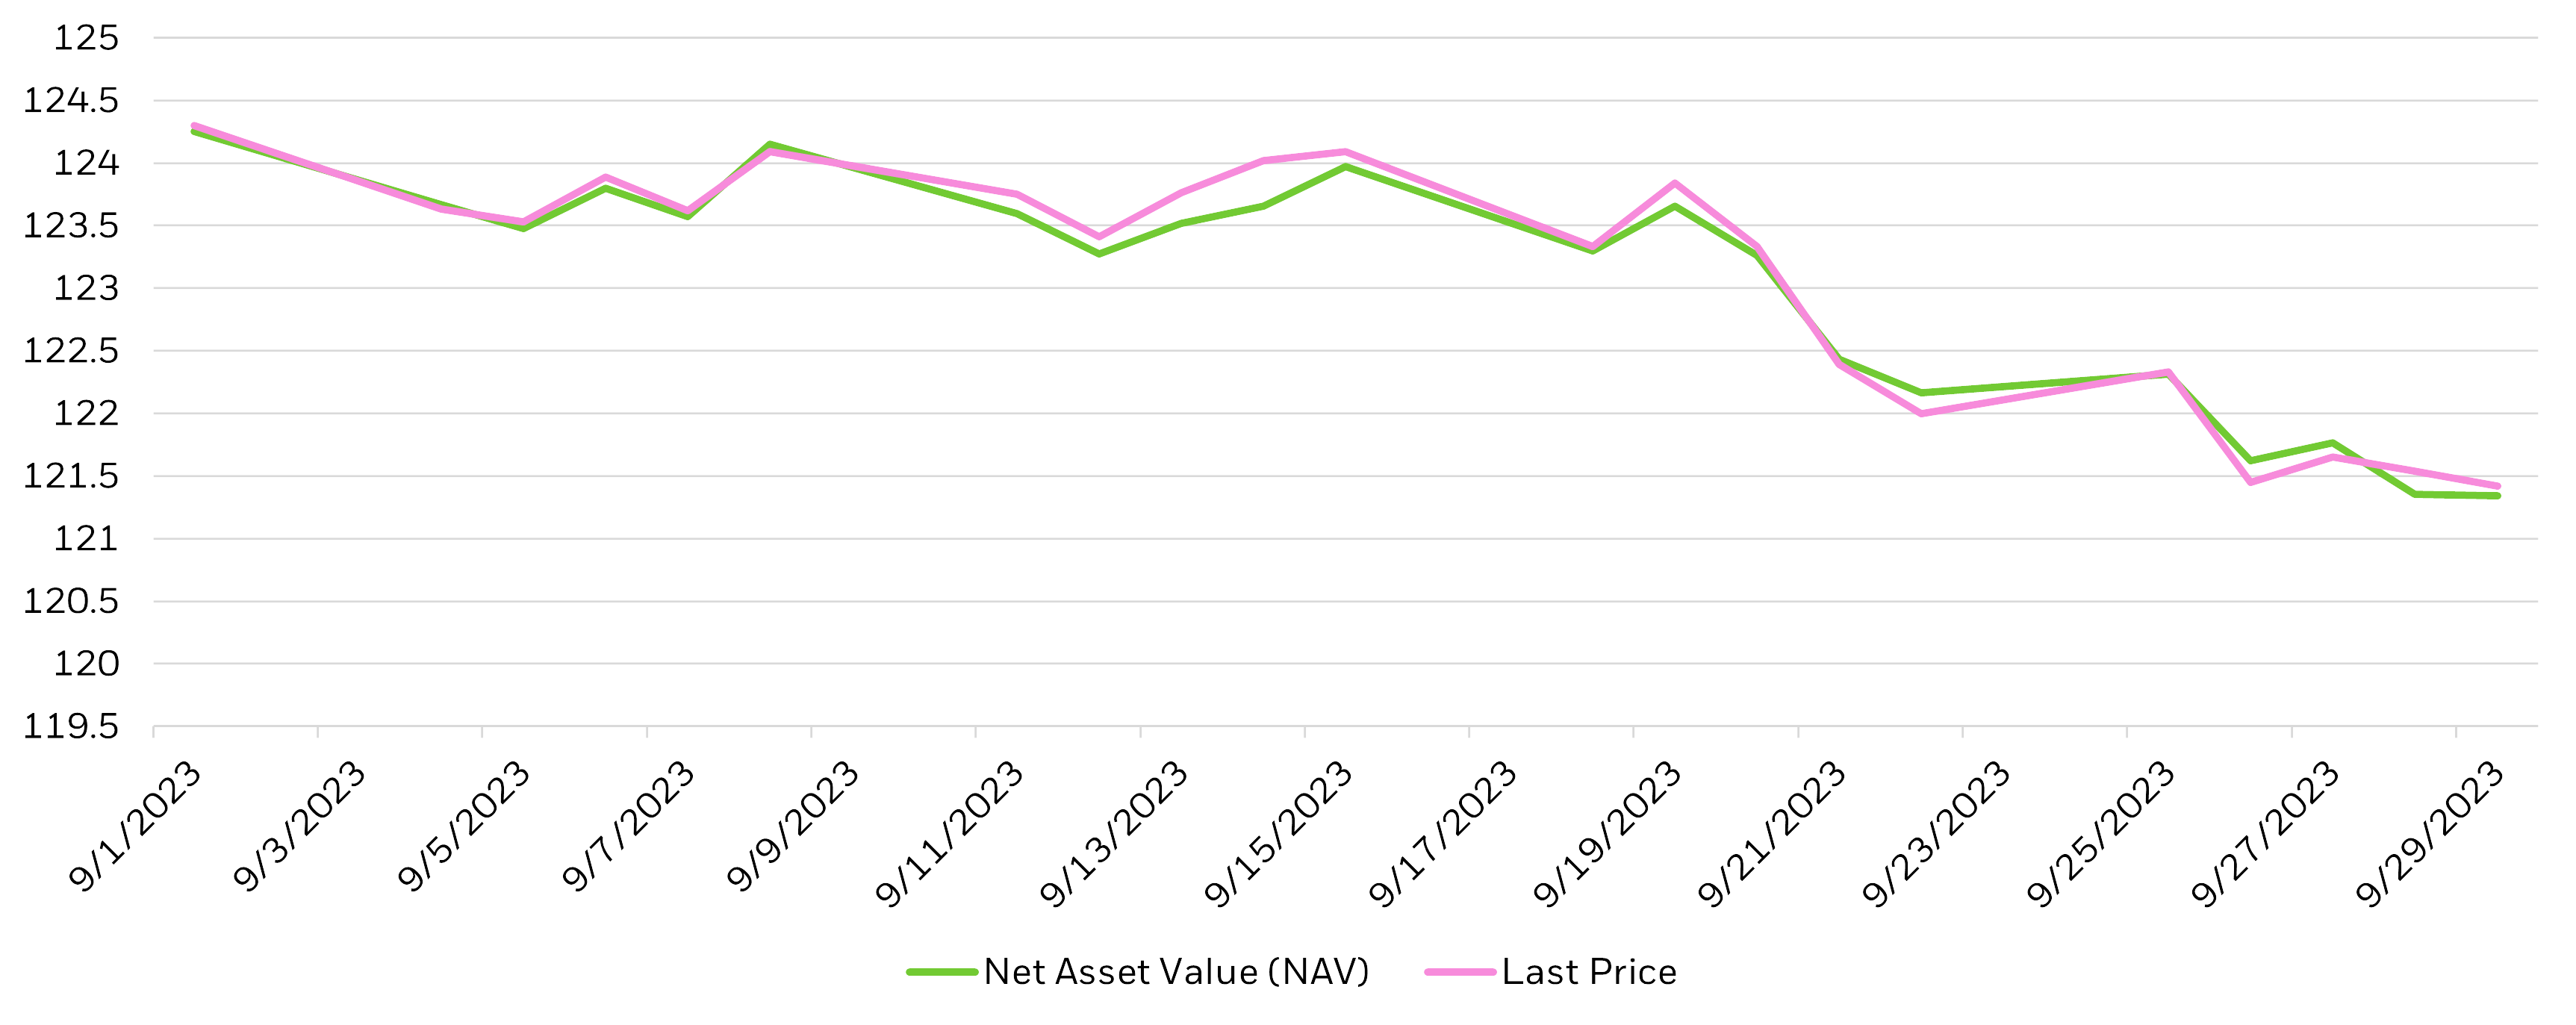
A key aspect of this is how efficiently your ETP will function. There are many moving parts which influence this, from how often the ETP trades on exchange, to the costs involved in trading, how closely it tracks the relevant index, and whether its price accurately reflects the value of the underlying securities. Taken together, factors like these will help you assess what we call the market quality of the ETP.

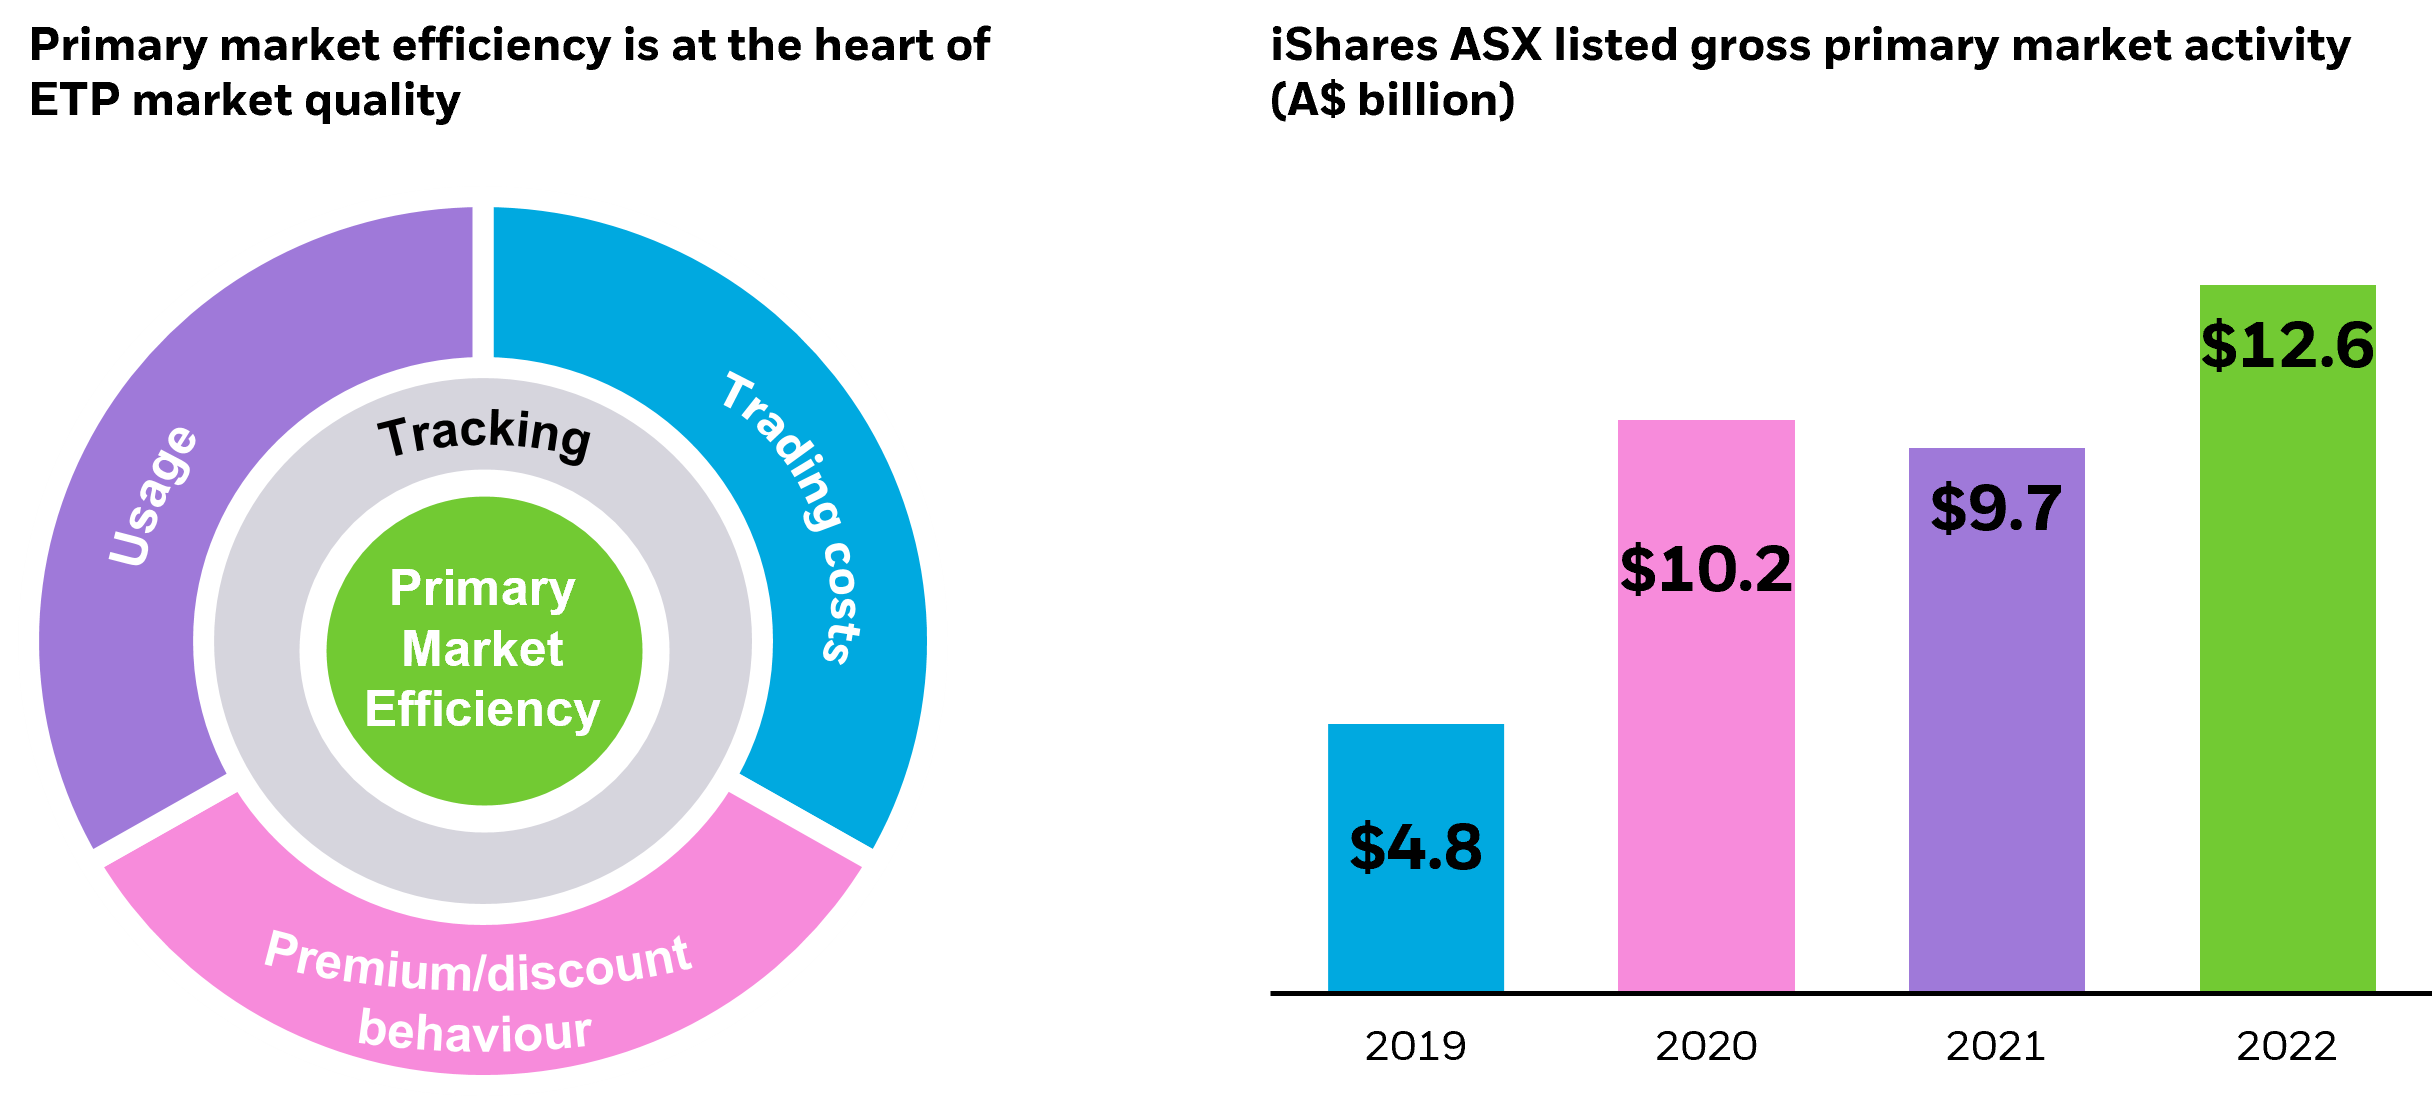
While there are many ways to evaluate ETP performance, this page explores five key metrics—usage, trading costs, premium/discount behaviour, tracking and primary market efficiency—that can help investors assess the market quality of an ETP. Together, these metrics can reveal an ETP’s ability to offer liquidity, price discovery and efficient access to markets in all market conditions.

For further information on terms that may help you to understand how an ETP functions, see our glossary at the bottom of this page.

1. USAGE

The flagship ETPs have matured from buy-and-hold asset allocation tools used predominately by Australian wealth clients building ETF portfolios, to liquidity tools that allow investors to trade the market. Market data shows that investors increasingly use our flagship ETPs to both allocate capital as well as transfer risk.

As trading volume in an ETP grows, more price information becomes available to buyers and sellers. The information gives market makers, who earn a “spread” on each trade, an economic incentive to offer competitive quotes (set the best prices) to attract trading volume.2 Competition between market makers ultimately reduces trading costs for investors.

Importantly, increased liquidity creates a network effect. The most heavily traded ETPs are typically the cheapest to trade, which spurs even more usage.

Usage in action

Trading in the iShares S&P 500 (AUD Hedged) ETF, has continued to grow over the past 5 years as this ETF provides a cost-effective way to gain a US Equity exposure hedged to Australian dollars. As at the end of September 2023 this fund was the largest hedged US Equity ETF with A$1.2bn in assets.3

Over this period, the trading volume has increased, particularly in the last year (see below). The rise in trading volume and competition has contributed to a fall in the trading spread. At the end of September 2018, the 20-day average trading spread was 15bps compared to 6bps at the end of September 2023.4

iShares S&P 500 (AUD Hedged) ETF - Monthly trading volume (# shares)

ishares s&p monthly tading volume graph

Source: BlackRock, Bloomberg as of 29 September, 2023.


2. TRADING COSTS

Bid-ask spreads, or the cost of trading into and out of a fund, can vary significantly from ETP to ETP. Spreads can be impacted by security-specific criteria, including asset class/exposure, time zone, as well as broader market conditions.

The comparative asset class/exposure volatility will be reflected in the spread, in general, the more volatile the asset class/exposure the wider the bid-ask spread. For example, comparing a cash exposure such as the iShares Core Cash ETF, with an Australian Corporate Bond exposure (iShares Core Corporate Bond ETF) or an equity exposure such as Emerging Markets (iShares Emerging Markets ETF).

We observe for some Asian markets where the underlying exposure overlaps with Australian trading hours, that the spread can be wider in the morning when the underlying market is not open. During this time, the price is based on correlated instruments such as futures and FX rates to the trading currency.

ETP bid-ask spreads that are tighter than those of the ETP’s underlying holdings, or exhibit less sensitivity to stressed market conditions, can signal high market quality. In other words, ETP bid-ask spreads that are tighter than the spreads on their basket of underlying securities, or that widen less than their basket spread in periods of volatility, can indicate healthy trading activity.

Trading costs in action

Spreads on our flagship Australian Equity ETF; the iShares Core S&P/ASX 200 ETF (IOZ) consistently trade below the spread of the underlying basket of 200 securities.

The chart below compares the average daily spread of IOZ in September 2023 compared to a weighted average daily spread of the basket of 200 securities. IOZ trades on average 6 basis points (0.06%) lower than the underlying basket.

Bid-ask spread of the iShares Core S&P/ASX 200 ETF (IOZ) versus underlying securities

Bid ask spread of the ishares core S&P/ASX 200ETF (IOZ) vs underlying securities graph

Source: BlackRock, Bloomberg as of 29 September, 2023.


3. PREMIUM/ DISCOUNT BEHAVIOUR

An ETP’s market price is typically in line with the value of its underlying securities, but it’s possible for ETPs to trade at prices above (premium) or below (discount) the current value of their assets.

If the price of an ETP share is greater than the value of its underlying securities, the ETP is said to be trading at a “premium.” In response, market participants may engage in arbitrage by buying the underlying securities and exchanging them with an ETP issuer (via an authorised participant, or AP) in return for newly created ETP shares, which may then be sold in the market for a profit.5 The ability to exchange the ETPs for either cash or the underlying assets provides economic incentives for market makers to trade when the price deviates from the value of the underlying assets. This self-policing mechanism is the reason. Tight alignment to NAV can therefore be evidence of a high-functioning arbitrage mechanism. 

Evolving market conditions can result in persistent ETP premiums and discounts. In certain instances, such as when underlying markets are illiquid or stressed premiums and discounts can illustrate how ETP prices provide price discovery to markets by offering real-time information about market conditions. For example, in times of lower liquidity in fixed income markets, investors can turn to frequently traded bond exchange traded ETPs for clarity about what is happening in fixed income markets and to actively adjust their portfolios. Observations from our global business suggest that bond ETPs may reflect the conditions of the markets while improving price transparency and providing access to liquidity in periods of market stress.

The key point is that an ETP’s alignment to NAV in stable or liquid markets, and the appearance of ETP premiums and discounts in illiquid or volatile markets, help provide information about an ETP’s market quality.

Premium/discount behavior in action

When measuring premium/discount by comparing the net asset value (NAV) price for the portfolio with the closing price of the ETF, it is important to consider any time zone differences. For example, the ETF NAV price of a US exposure would be calculated at the close of the US market, which is the following morning in Australia, and as such this timing difference can explain some of the observed price differences.

The Australian listed ETFs tracking a local time zone basket of assets such as Australian fixed income generally exhibit close tracking between the closing price and the portfolio NAV price. Below shows the tracking to the exchange closing price over the last month for the iShares Shares Government Inflation ETF (ILB).

iShares Government Inflation ETF (ILB) closing price versus NAV price

Shares govenment inflation ETF (ILB) closing price vs NAV price

Source: BlackRock, Bloomberg as of August 30 2023.


4. TRACKING

“Tracking” measures the difference between a fund’s return and the benchmark index’s return. Tracking difference measures the performance difference between the fund and the benchmark whereas tracking error measures the volatility (standard deviation) of this tracking difference month-over-month.

Index ETPs are designed to deliver returns that are consistent with the returns of their benchmark, but closely replicating benchmark performance consistently over time is no small feat. Superior tracking requires specialised portfolio management expertise, including the ability to continuously balance cost, risk and return to deliver precise performance outcomes.

Some of the key elements in tracking the benchmark include an in-depth knowledge of index methodologies, trading efficiency and optimal portfolio construction (e.g., whether to fully replicate an index or hold a representative sample of index securities).

Tracking in action

The chart below shows the annualised (or per year) tracking difference over the last 3 years for a selection of ASX ETPs. Theses ETPs include different asset classes, country exposures (Australian and International) and strategies (e.g., factors and sectors). The performance for all our ETPs can be seen on the website product pages.

The tracking difference incorporates the management fee and rebalance trading costs as well as any miss-tracking positive or negative (which can come from portfolio management, tax or lending activities among others). As it can be seen, some of the ETPs have an annual tracking difference less than the annual management fee.

Annualised Tracking Difference in the last 3 years compared to the management fee

Annualised tracking difference thelast 3 years compared to management fee

Source: BlackRock, as of September 2023.

There was a reduction in management fee in IAF and IOZ in February 2023. For most of the performance period the higher management fee was applied to the fund NAV.6


5. PRIMARY MARKET EFFICIENCY

Even though for mature ETPs most trading occurs in the secondary market (where investors buy and sell existing ETP shares on exchange), efficient primary market operations — the creation and redemption of ETP shares — is at the heart of ETP market quality.

Primary market efficiency is essential to the functioning of the “ETF arbitrage” mechanism (as previously described in section 3), which helps keep the price of an ETP in line with the value of its assets.

An ETP’s primary market efficiency typically relies on market participation and platform stability. For example, an ETP that interacts with a diverse set of APs will have a more competitive market in which APs are motivated to capture volumes. More market participant involvement can provide additional support for the ETP’s primary market operations. Likewise, ETPs backed by platforms that leverage technology and scale are more likely to efficiently process ETP primary market activity.

iShares Australia benefits from global scale and expertise. In addition, by wrapping liquid exposures from more mature ETP markets, the Australian business leverages the exchange (secondary market) liquidity of the held ETP to reduce the cost of primary market transactions.

Primary market efficiency in action

As the Australian market continues to grow, the primary market flows increase too. For example, the gross value of the primary orders in iShares Australian listed ETFs in 2022 was over A$12bn, showing substantial growth from 2019, and so far in 2023 the gross value is already over A$8.7bn.7

The gross primary market flows of our flagship Australian equity exposure, the iShares Core S&P/ASX 200 ETF (IOZ), grew from A$722m in 2019 to A$4.9bn in 2022, which represents an increase of nearly 600%! 8

Primary markets efficiency graphs

Source: BlackRock, as of December 2022.


PUT IT TOGETHER

Each of the metrics described in this paper is useful to investors in isolation and when combined, they provide a more complete picture of an ETP’s market quality.

Take the iShares Core S&P/ASX ETF: IOZ as an example of how the five metrics demonstrate market quality.

Usage. In the last 5 years the monthly trading volume of IOZ grew by around 5 times and the 20-day average trading spread reduced from 6 basis points (0.06%) at the end of September 2018 to 4 basis points (0.04%) as at September 2023.9

Trading costs. IOZ trades consistently with a bid-ask spread that is on average 6 basis points (0.06%) below the underlying basket of securities. This provides investors with a more cost-effective vehicle to access Australian equities.10

Premium/discount behavior. IOZ’s absolute premium and discount (closing price vs fund NAV) was 4bps in line with similar large cap ETPs in September 2023.11

Tracking. Importantly, IOZ continues to tightly and consistently track its benchmark, exhibiting a tracking difference of 0.08% annualized (per year) over the last 3 years.12

Primary market efficiency. The ETF arbitrage mechanism for IOZ was supported by an efficient order process. This means that during the day the ETF value did not materially differ from the independently calculated value of the basket of securities (or iNAV).13

Evaluated together, these metrics—usage, trading costs, premium/discount behavior, tracking and primary market efficiency—showed that IOZ exhibited high market quality.

As a core exposure for Australian investors, IOZ reduced the management fee to 0.05% (previously 0.09%) in February 2023.

GLOSSARY

Absolute premium/discount: The absolute value of the difference between an ETP’s share price and its net asset value (NAV).

Authorised participant (AP): Financial institution that manages the creation and redemption of ETP shares in the primary market. Each AP has an agreement with an ETP sponsor that gives it the right (but not the obligation) to create and redeem ETP shares. APs may act either on their own, or on behalf of market participants.

Bid-ask spread: A measure of the average cost to buy and sell securities on an exchange. Spreads are the difference between the bid price of the trade (what the buyer is willing to pay) and the ask price (what the seller is willing to accept).

Gross primary market activity: The total dollar value of all creations and redemptions of ETP shares.

Liquidity: How easily an asset can be bought or sold.

Market maker: A broker-dealer that regularly provides two-sided (buy and sell) quotes to markets.

Net asset value (NAV): The value of all the securities held by the ETP, often expressed as a value per share. An ETP’s official NAV is calculated once per day based on the most recent closing prices of the underlying securities.

Net primary market activity: The dollar value of creations of ETP shares less the dollar value of redemptions of ETP shares.

Primary market: Where authorised participants transact with ETP issuers to create or redeem ETP shares.

Secondary market: Where investors buy and sell existing ETP shares on exchange.

Tracking difference: The difference between a fund’s return and its benchmark’s return over a certain period.

Tracking volatility: The standard deviation of a fund’s month-over-month tracking difference.

Wrapping or wrapper ETP: An ETP the holds one or more ETPs in order to gain benchmark exposure.

LATEST INSIGHTS FROM iSHARES