Key points
-
01
The alternative data edge:
Alternative data became more appealing during the COVID crisis as alternative data insights did well on average, while insights based on traditional data struggled during his period.
-
02
Diversifying and Refreshing:
By actively monitoring performance of alternative data insights, Systematic investors can assess when it is necessary to diversify and refresh the portfolio.
-
03
Greater breadth and scale:
Alternative data is often incredibly granular and rich which allows us to address a wide range of investment questions.
Differentiated performance
Alternative data became particularly appealing during the COVID crisis. There was large dispersion in activity across companies and corporate outlooks became increasingly uncertain due to the market environment and reduced company guidance. What was particularly interesting about 2020 was how insights based on traditional data struggled during this period of time.
In Figure 1 below, we summarized headline statistics of our internal signal library to quantify the edge from alternative data. We focused on Information Ratios (IRs) of each signal implemented standalone, although our active portfolios are always careful to blend multiple signals. IR is the return of stocks the signal favored (long positions) minus those of the stocks it disfavored (short positions), divided by the volatility associated with this return. Using this calculation, we compared across signals with differing natural risk levels.
Figure 1: Distribution of IR, January-June 2020

Information ratio distribution by type of data for January–June 2020; proprietary BlackRock library of 31 alternative data vs. 64 traditional data insights.
An important property of Figure 1 was that both families of insights had a significant number of negative alpha signals. That’s what happens in real life as opposed to backtests; just as life itself, not everything works out as planned. Fortunately for our clients and ourselves, the average IR of both families of signals was positive. The alternative data signals had a clear edge, with an average IR of above 1 vs. 0.2 for signals relying on more traditional data sources. The challenge with traditional insights has been the more extreme negative tail. In a sense, the generalized use of traditional data to develop investment insights has made them prone to significant drawdowns when market conditions turn unfavorable — since a lot of market participants often trade a similar type of insight, such as accounting quality or value.
Frontier of innovation
As data sources become more widely known — which is the case for market and accounting data — insights built from this traditional data tend to become easier to replicate and traded by more participants. As in any other market, this increased competition reduces the gains to those of us who use the ideas.1 Alternative data helps stay on the frontier of innovation when it comes to new systematic ideas and alpha generation.
To illustrate this, we explored the decay in efficacy of data through time. We focused on the analyst earnings estimates dataset as an example, which was rather niche in the early 2000s and could be viewed as “alternative data” at the time. Since then, many academic papers have been published on this type of data, analyst updates hit every popular financial news outlet, and there are myriads of websites tracking analyst recommendations.
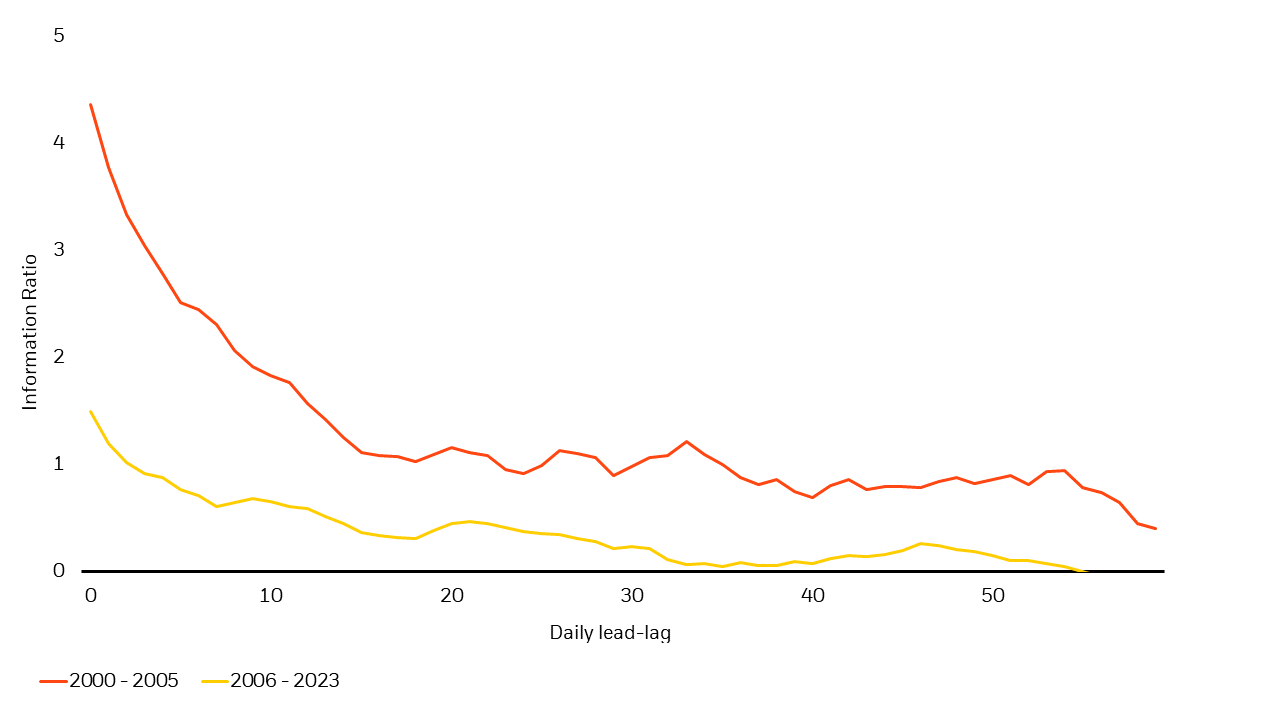
Figure 2: IR decay for analyst revisions by time period

Information Ratio decay profile for lagged implementation, i.e., waiting to trade, an Analyst Revisions portfolio, over “early” period for the dataset (2000–2005) vs. “recent” period (2006–December 2023).
Not surprisingly, the alpha potential of insights derived from analyst estimates data has materially deteriorated through time. In Figure 2 we show how performance becomes increasingly hard to capture for a signal that trades recent trends in analyst earnings per share estimates. Over the 2000–2005 period, the signal has an IR above 4 if implemented as soon as data becomes publicly available (lag 0), with IR still around 0.7 after 40 trading days. The subsequent 18-year period has not only decreased the forecasting power to IR just above 1.5 (lag 0), but the performance of the signal is now all gone after 40 days (IR 0).
How would an investor address the challenge in accounting for this decay in efficacy? First and foremost, by actively monitoring the performance of alternative data insights (just like one would do for any investment insights). More importantly in competitive markets for alpha, it is necessary to continuously diversify and refresh the portfolio of these insights. This quest for innovation could be about bringing in new data, in addition to coming up with more nuanced approaches for existing data already available in-house.
A richer opportunity for analysis
Alternative data is often incredibly granular and rich, which allows us to address a wide range of investment questions. Let’s say we want to use information about the labor market to forecast returns. Accounting information on a company’s employees tends to be scarce, with R&D expenses and employee expenses being probably some of the most granular fields one can find, and even these are not disclosed explicitly by many companies. Various government statistics around the unemployment rate or labor costs are often reported at a lag and are usually not granular enough to provide information about any individual company. In contrast, job postings offer a fascinating opportunity to understand many facets of what is happening at a company. A simple trend in hiring demand can give an indication of company outlook, more job postings in a particular location may help signal economic business conditions in a city or country, while the job posting text provides information around the skill sets and technologies that a company is focusing on.
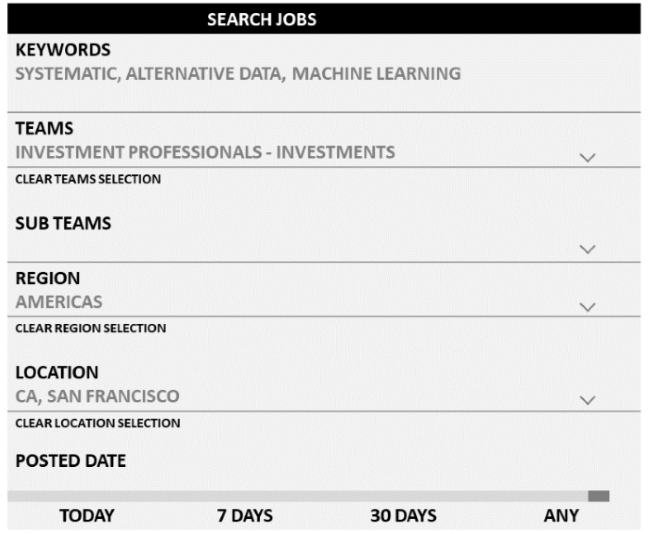
Figure 3: Screenshot of the BlackRock Careers Portal

As an example, Figure 3 shows a screenshot of the BlackRock Careers Portal. One can immediately notice the additional angles of information that a job posting provides — including keywords in the job posting text, name of a particular team, location of the job, and the date of posting.
We next turn to two adages in quantitative investing which also apply to alternative data.
Quantitative investing adage #1: It’s all about breadth
While some alternative data insights were strong in 2020, over the long run performance tended to be more modest. Different insights can pay off at different times. Some insights work better around the time companies release earnings, while others pick up on slower trends that play out over several months. One of the most effective ways to address this time-varying predictive power is to have many differentiated insights in our portfolios at all times.
We outlined a version of the Fundamental Law of Active Management (Grinold, Kahn, 1999), to help us understand the effectiveness of alternative data. In this version we interpreted breadth as sources of information — or number of datasets — rather than assets in the portfolio.

From our experience, it is hard to tell a priori if a new dataset will have an extremely high forecasting ability when implemented in portfolios. Historical backtests, especially over a short sample, can only tell us so much. Therefore, it is the number of datasets at play we can control. Even better, if we can come up with several different ideas from the same dataset, this further increases the breadth of our insights.
To empirically validate the Fundamental Law, we simulated portfolios to include an increasing number of investment signals. For each level of breadth of signals, we make 1,000 random draws from an internal library of 74 signals (traditional and alt-data based) and compute the average IR. Signals are combined equal-weighted, but sampled with replacement,2 which means certain signals can achieve higher weight (proxying for how portfolio managers often apply conviction upweights). Most of these signals represent distinct pieces of data, but in some cases there are multiple features derived from the same dataset.
We find evidence that the portfolio IRs roughly improve at a pace equal to the square root (sqrt) function of signal breadth. As an example, per the formula above let us infer the “Forecasting Accuracy” of the datasets used is 0.25. The Fundamental Law would infer that 10 signals would yield an IR of 0.8 (0.25*sqrt(10)), 20 signals would yield an IR of ~1 and 30 signals an IR of 1.2, which very closely match the simulated results shown in Figure 4.
The conclusion here is to incorporate as many different datasets to the portfolios as possible — while being aware of this “fundamental law of alternative data” — that an additional new dataset tends to provide diminishing returns to an investor.
Figure 4: Portfolio IR vs. number of signals

Information Ratios for portfolios with different signal breadth, simulated from random draws of a library of 74 insights, based on both alternative and traditional data. The period for performance measurement is June 2017–December 2023. IRs exclude transaction costs, but insights are sufficiently lagged and slowed down to turnover levels to be capturable in a realistic investment process.
Quantitative investing adage #2: Benefits of scale and technology
The beauty of systematic investing is the scale that it offers in terms of incorporating many different data points. The same piece of code can be applied to processing tens, hundreds, even thousands of different datasets. And the more insights we have in a model, the more powerful it will be.
With alternative data, technology is particularly helpful during the first stage of evaluating how useful the dataset is in an investment process. In contrast to “traditional” data, such as accounting information — which comes in a clean and structured format — alternative data is often messy and large. It can often take several intensive steps to get it into a useful form — such as mapping, cleaning, and aggregating.
We have found that the first order solution to deal with such issues is to standardize and streamline as much of the above process as possible. This can be done on our side via automated tools or done on the vendor side so that they provide a version of their data which is easier to work with.
And once we do have many datasets in a comparable format, technology can again be leveraged to quickly iterate through various hypotheses that we as investors have about using the data, to gain new insights about a particular phenomenon, or feed the data into a machine learning model for a less supervised approach. Finally, with the right infrastructure in place — the marginal cost in terms of time to incorporate any additional dataset decreases as better infrastructure is built. This helps balance the fundamental law when it comes to alternative data from the previous section.

